Heat mapping your venue has always been an incredibly good thing to do. It allows you to look at where you can place pricing bands, squeeze additional income and even develop accessibility. But can you do it yourself? I think so, and so, over the next 1,159 words I’ll be going through the process of how to do it.
The information I will be using will be from a small studio theatre (Unity Theatre) and for a single show (Hal Cruttenden) – but the principles remain, all I’ll be missing out is a section on aggregating data (which is pretty simple, feel free to tweet me about it). I’m also using the Spektrix box office system which is very nice (other systems are available).
So, where to begin.
We know that heat mapping essentially measures demand and preference, it tells us which seats are coveted more that others. We need to start with the raw data of what’s happening in every seat. I’m using a new sales report for this (no need to ask Spektrix to build you anything!), with a simple single event selection criteria and various outputs.
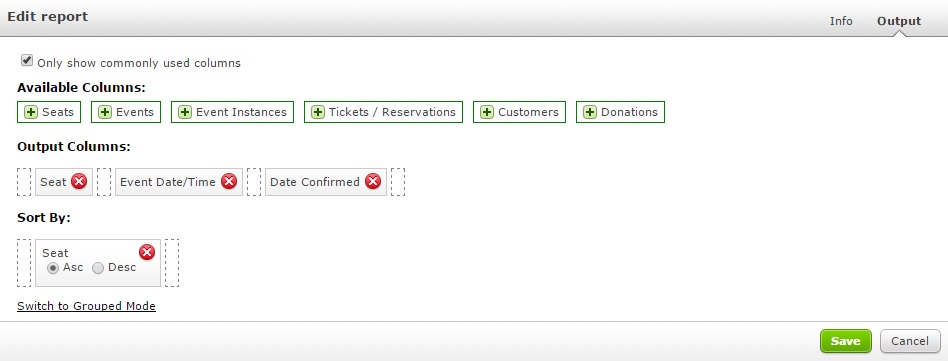
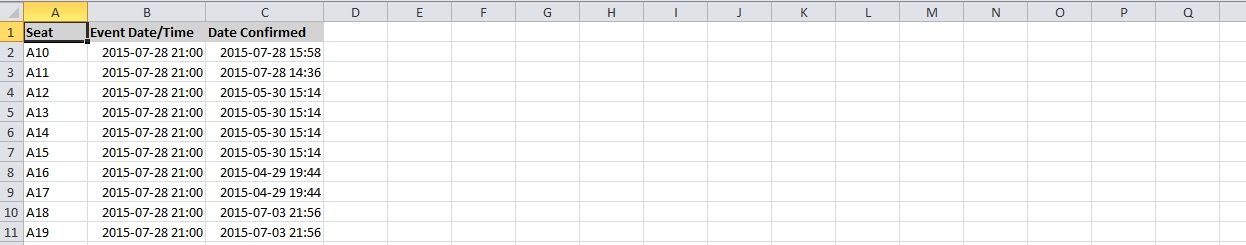
So we’ve got three bits of data, seat which gives us the seat number, event date/time which is the day of the performance and date confirmed which is when the ticket was purchased. Obviously if you’re a bigger theatre you add in area as well to separate the stalls from the dress circle etc… So we run this report and we get an excel report that looks a bit like this.
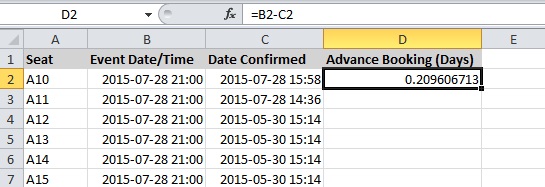
Now this information isn’t terribly useful at the moment. What we need to do is get number of days prior to the performance each ticket was booked.
Now, if you chat with Spektrix they’ll direct you to an analysis report for this, but with excel you can get the same result (and also at an advanced level look at loads more detail – e.g. looking at shows in relation to genre to answer questions – do people sit further back when there’s stand up on or do they move forward?).
So we add a new column D called Advance Booking (Days). We take the Event Date/Time and minus the Date Confirmed. This gives us a numerical value for the advance. As you can see in my example, that ticket was bought on the day so is a proportion of a day (0.2 days in advance).
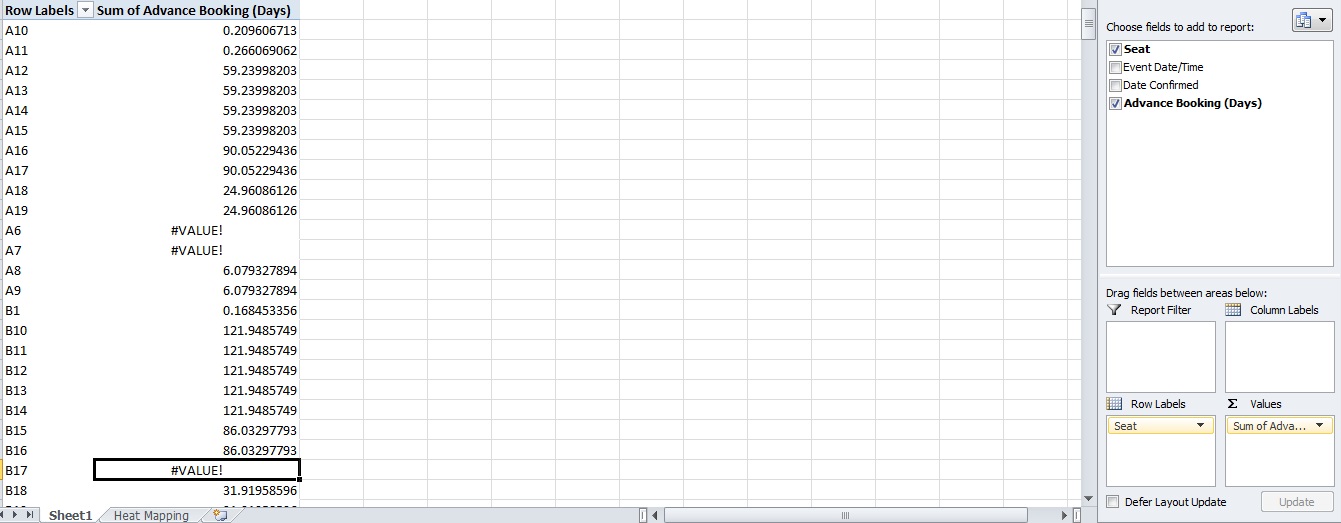
So we apply this to all our seats – if you do this over a month or years that might be 200k lines of data, so be prepared. Also your PC will slow down a bit. Some unsold seats may register as #VALUE! which means that excel can’t do the sum as it’s impossible. Don’t worry (although it’s unlikely to be an issue with bigger data sets). There’s other ways of eliminating these seats and also using multipliers to assess unpopular seats that are simply rarely used to ensure that any bias is counteracted!
Now we have our data we’re going to insert a pivot table. This allows us to aggregate our data (although quite unnecessary in this example!). So we create a pivot table that looks a bit like this:
Now we need to translate this into a seating plan. This is the boring bit. You have to recreate your seating plan on excel. Dull. Sorry! I’ve not made my tremendously attractive and it’s a really simple plan but you can see underneath how it works. Lots of boxes and seat numbers. Then comes a period of data entry, essentially linking the data in the pivot table into the plan. So the data from A10 goes into the box for seat A10 – simple. I’ve also rounded the figures to make it all simpler (but rest assured it doesn’t make a difference – it just hides the detail!).
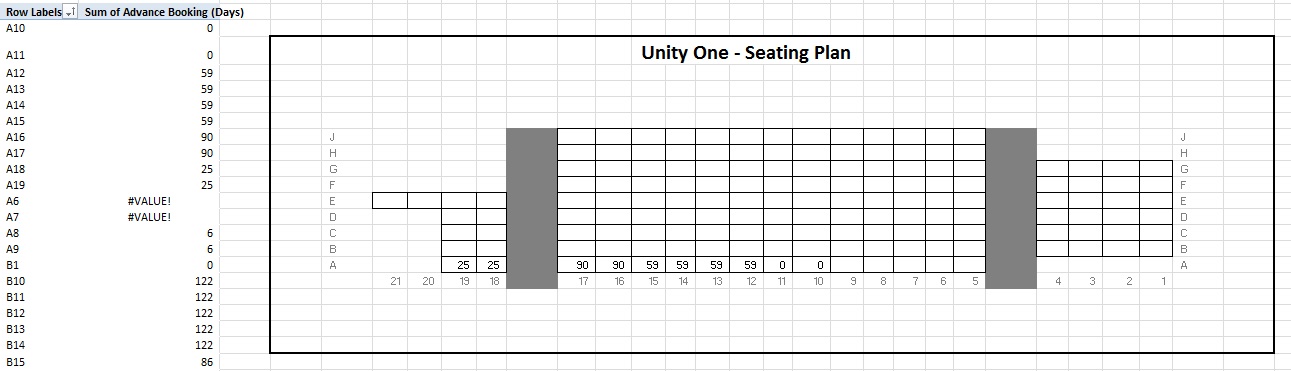
As you can see I’ve added in some of the numbers. So seats A16 & A17 were booked 90 days in advance (yey) and seats A10 & A11 were released at the last minute so bought on the day (yey). Of course when you use aggregated data from multiple performances you get a much clearer picture on how your auditorium is working – because I’m demonstrating with just one show the results will be blocky! It’s also worth mentioning that if you have different areas you can split them across different sheets in excel – there’s some lovely functionality you can use to keep consistency which is particularly useful if, for example you are looking at touring versus homemade shows or looking at different genres. Be aware that in my data there are gaps in the mapping as the performance didn’t sell out!
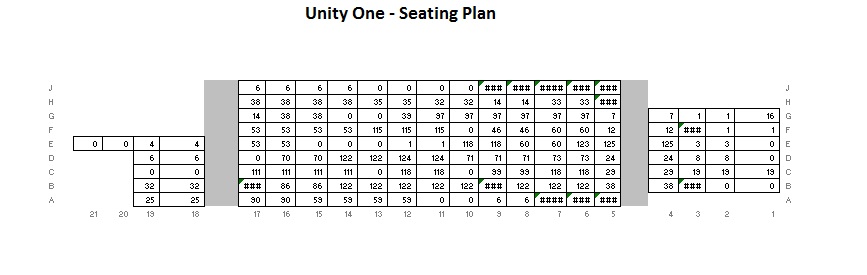
So here we have (some 20 mins later) our completed seating plan for the performance of Hal Cruttenden (comedian) at Unity Theatre. Not all the seats sold so they have ### on them. Some are house seats (J 5 – 9) and wheelchair seats (A5 – 7). The next thing we’re going to do is add conditional formatting.
This formats the information in the chart/seating plan depending on conditions we set. So for example you could say that on any seat where people booked over 30 days in advance you want to put a star. You select the format of a star to any box that meets the criteria (booked over 30 days in advance). The newer versions (2010 onwards) have some pre installed versions.
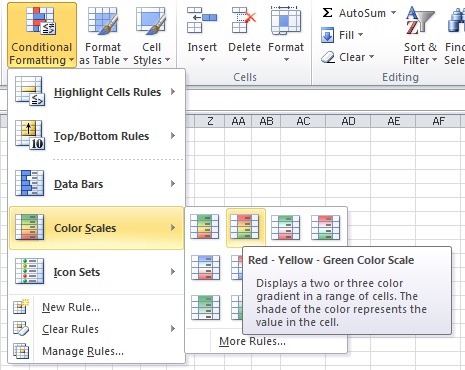
As you can see there are lots of options so you can really set your own boundaries. However for us I’ve gone simple for a traditional 3 colour scale – so red seats are the higher numbers, green are lowest, and orange in the middle. For most people you won’t need to get any more complicated than that! So how does my plan look?
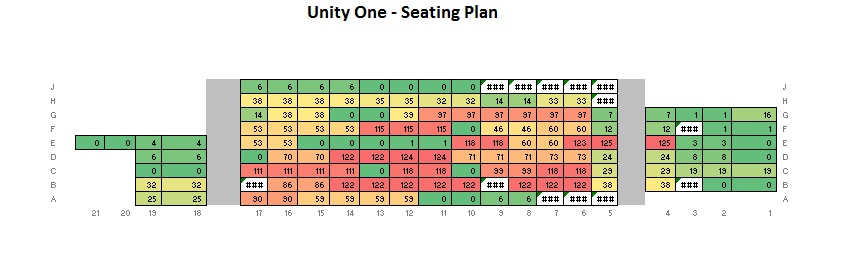
This is just a sample with one show but we can learn a lot from it. Red is popular seats, green are less popular.At the moment the entire auditorium is the same price ( all £8 as this was a preview). This information might encourage us to:
- Increase the price of tickets in the centre block front 4 rows to £10
- Reduce the prices of the tickets on the periphery (particularly E20 & E21) to £6
We can also see an anomaly. Have you spotted it?
Seat E4 – they’ve clearly misunderstood the seating plan and booked two seats across an aisle. Maybe two people with long legs? Maybe they should pay extra for the extra room?
This would, basically, create 3 price bands potentially which would increase ticket yields (I’ll tell you how to do that another time, again, great for spreadsheets!). There’s also the final question about accessibility. Well we’ve opened up the pricing a bit now, originally all the seats were £8, now there’s a range of options from £6 – £10.
I hope you enjoyed this blog. Please tweet me @mrfreeman1984 if you’ve enjoyed reading it or, if you’d like a chat about me doing some low cost heat mapping on your seating plan with some added extras drop me an e-mail through my contact form.