
An introduction where I mention my holiday.
I’ve been for a relaxing holiday.
‘It’ll be great’ I was told by colleagues, ‘clear your mind’ they said, ‘don’t even think about what’s happening back here’ they reiterated. And it was a great holiday – relaxing, stress-free and calming – we went to Murcia in Spain where we walked, ate and looked at things that may, or may not, be Roman. For the first couple of days my shoulders felt tight, I felt the pangs of anxiety hit every time we walked past the Theatre in central Murcia and, to be honest, my mind didn’t clear until… Until it did. Then my head moved from ‘things I worry about constantly at work’, to a different state, a state of ‘things that I should think about for work’.
You see, a relaxing holiday.
I’ve been thinking increasingly about data and what it means to be data-led. Lots of us talk about being data-led – you go to any arts conference and you’ll hear speakers talk about being data-led and the audience nod approvingly as they frantically write notes. The problem is that while we’re good at saying the words ‘data-led’ I’m not sure we actually are good at living those words, and certainly not good at articulating data.
Why we’re not as data-led as we’d like.
We all want to be data-led. We want to be able to reply to a question with a graph. We want that graph to give a clear direction of what we should do. We ideally want the things we should do to be in green and the things we should stop to be in red.
Sadly though it doesn’t work like that.
Firstly there’s so much fucking data.
Loads.
Tonnes.
From box office and website analytics to surveys and mailing reports.
It’s overwhelming.
Secondly it’s incredibly rare that one data point will be able to give you real objective clarity. A low response rate for a mailing could mean a myriad of things from audience disinterest to poor copywriting to limited availability. How do you distinguish which?
Finally, even if we can take the “loads” “tonnes” “overwhelming” amount of data we have and put it in one place – often the next barrier is how to approach it, to visualise it, to read it, interpret and then to communicate it.
We want to work like Amazon, or Ebay, but the reality is we don’t operate on that scale, we don’t have data scientists pouring over the results, or access to AI learning. It’s us doing everything, and, frankly, the show’s director has asked you to send 15 more tweets to “drum up audiences”, the costume designer is “furious about the production shots you’ve used” for advertising, meanwhile you’ve got a meeting with the local amateur dramatics group who want to do “a new, nude version of Hamlet set in post-apocalyptic Doncaster” and you have to talk them down, and WHO HAS THE WILLPOWER/TIME/MENTAL CAPACITY TO GET CLOSE TO DATA!
Ahem.
We all want to be able to communicate certainty. But we, almost certainly don’t have it – no-one does – what we have is the view of the tip of an iceberg, or a single frame in the scene of movie, or the tantalizing brief glimpse of a caught eye across a bar without seeing the face – we have limited information, but that information is more valuable than not having any information at all.
A fictional example.
Here’s an entirely fictional example.
Your venue has a regular comedy club that runs monthly. Sales have been in a prolonged slow decline. Booking is late, often on the night. You’re told the night is good. Sometimes there’s a night that sells out, but it’s increasingly rare. Bar sales are poor. The show finishes at 11pm and sometimes later.
Keep this in your head. We’ll be coming back here.
Quantitative and Qualitative data.
This may seem obvious but there are two major types of data: Quantitative and Qualitative – knowing the difference is really important. What is of equal importance, particularly in the arts, is that using them together is vital. Simply put…
Quantitative data is data that can be counted numerically. So how many tickets we sold (32), the value of the tickets (£320) or the average rating people gave the show (6.2 average).
Qualitative data is data that can’t be counted or can’t easily shared numerically. It’s collected from text, audio or visuals – e.g. “The show was shit because the first act wore a terrible hat”.

The five data sources I think are vital.
I was thinking about the data source that, at the moment, are most valuable for me. These are the ones where I can a) get data easily, b) that data tells me something and c) I can make changes to, hopefully, set us on a better course. All while, of course, not forgetting that what I’m seeing is a fraction of a picture.
Also worth saying (as I’m sure someone will be thinking it) – that we don’t always have the luxury of gathering everything we need to see the entire picture (we have finite time/resource). So inevitably we make decisions that are wrong – my feeling is that if something isn’t working that has a finite lifespan then action rather than inaction will teach you more, quicker, than the inertia of waiting for the extra information that you don’t/can’t/don’t have resource to get.
- Sales
We’re talking the vast amount of information that pours in and out of your box office system. Every ticket sold and reservation made. To give you an idea how much data we’re talking – I’ve got a Power BI table (Power BI is a Microsoft programme for data visualisation) that looks at 2016 to 2022 – the spreadsheets that power the visuals total around 6GB of data. Most people don’t have that sort of system though, so it’s the stuff that can easily go into reports or excel sheets. - Web Analytics
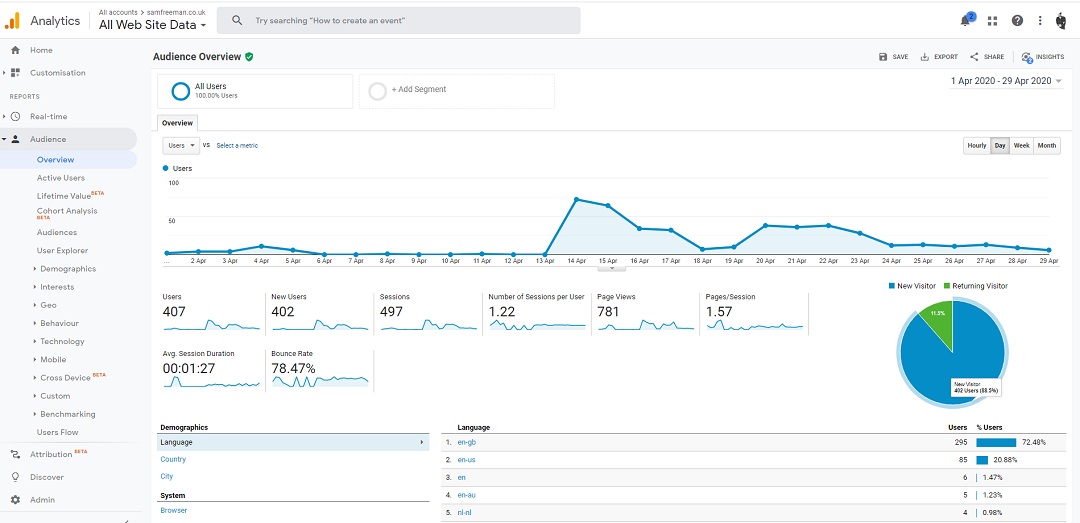
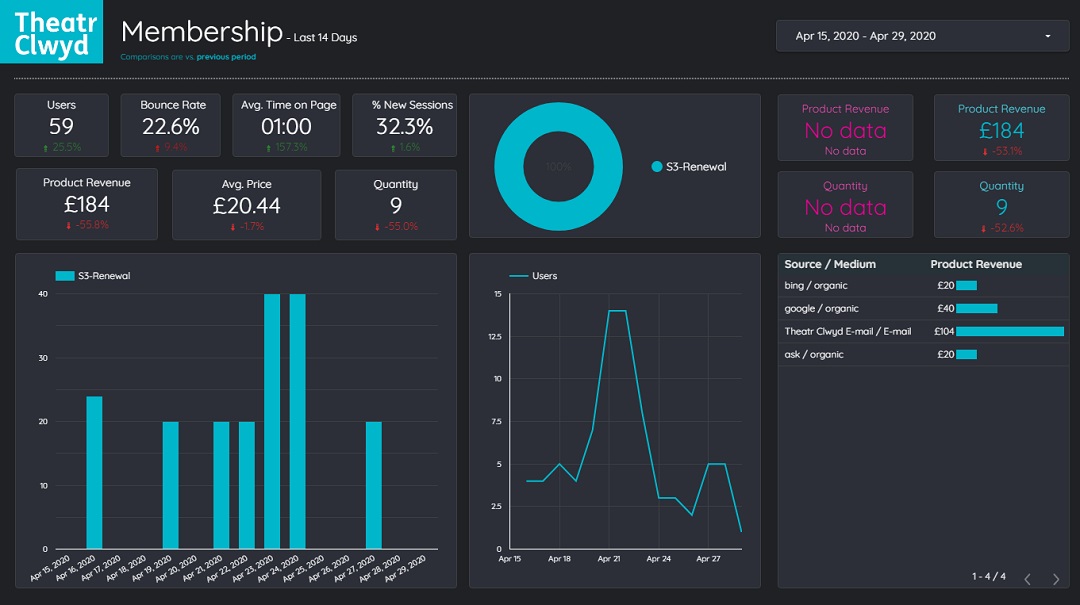
Usually Google Analytics – again it amasses a huge amount of data points about each and every interaction that customers have with our website. It can be linked to Looker Studio (formerly known at Google Data Studio) to simplify it, and it’s about to move into a bold new world with Google Analytics 4 (which no, I’ve not got my head around yet properly). - Mailings
Definitely linked to #1 – the impact we make from our mailings – postcards, brochures & letters. Regular readers will know I’m an advocate for them as a part of the marketing mix. For those who are dubious I tend to give the same explanation (which I’m very aware isn’t data-led – also worth saying this is the one I’m by far worst at doing regularly)…- E-mails
- How many e-mails do you get a day? (probably over 30 a day across 3 inboxes)
- How many go into your junk mail? (probably 10%)
- Do you open them all? (no)
- Do you read them? (maybe 1 in 10)
- Letters
- How many letters do you get a day? (maybe 3 a week)
- Do you have a junk mail? (not a thing)
- Do you open them all? (yes)
- Do you read them? (If they’re good)
- E-mails
- PPC/Social Media
Essentially campaign statistics for what we do (definitely linked to #2) – so this includes impressions, amount spent, clicks, likes, shares etc… - Surveys
We send surveys to audiences who’ve visited us to see a show – the questions have a mix between quantitative and qualitative questions and the likelihood of the recipient being asked each question depends on a number of factors:- How did they book?
- Did they use any of our services?
- Is this their first visit?
The key metric we should examine and measure.
Obviously we can’t look at every metric in every data set. I still get myself wound up, digging myself into the information, but then simply finding myself buried.
Buried alive.
In data.
So these are the 15 metrics I tend to focus on (obviously this is a slimmed down list):
- (Sales – by show) Sales Pacing
How is a show comparing to other similar shows – ahead, behind, about the same? - (Sales – by show and programme) % New Audiences
What % of the audiences are new audience and what % have been before? - (Sales – by month) % Capacity Sold
Is the % of our available capacity going up or down compared to the previous few years? - (Sales – booking channel) % by channel
Are people booking more online, in person, or by phone? - (Sales – by season) days booked in advance
How early are people booking? - (Web) Bounce Rate
How many people are visiting the website, thinking “fuck this” and instantly leaving? - (Web) Page Load Time
How long does it take for each page to load in seconds - (Mailing) Response Rate within 14 days
What % of the people you sent the mailing to actually booked within a 14 day attribution window? - (Mailing) ROI
What’s the ROI of the mailing we did? - (PPC) Impressions
How many impressions has the advert had? - (PPC) CTR
Click through rate – out of all the people who saw the ad, what percentage have clicked? - (PPC) CPC
What’s the average cost you’ve paid for each click? - (Surveys) Recommend to a friend
What % of the survey respondents who would or wouldn’t recommend their visit to a friend? - (Surveys) Enjoyed the evening
What % of the survey respondents that said they had an excellent or bad time (or a level in between more likely)? - (Surveys) Comments
What did they say when they did or didn’t have a good time?
That list is massive.
The key to all of those metrics is having comparisons – being able to compare to other events that have done well or done badly, so that you’re using a benchmark as a starting point to know if what you’re looking at is good or bad, a success or not.
So here’s a few grouping to make it easier…
- Surveys Group
I look at all 3 together. Anyone who says they wouldn’t recommend to a friend probably had a bad experience, and anyone who says they didn’t enjoy the evening probably the same – I tend to filter to find these people as they’re the most likely respondents to need immediate action.
Anyone who hated it I’ll contact personally, because we’re at risk of losing them as a customer – often I’ll comp them in to something as well with spare capacity, because, pragmatically, the value of time/comp to keep them is less than the time/effort to re-acquire them (while also mitigating a bad experience and potential bad word-of-mouth).
I tend to tailor to each individual based on the comments – but I also skim read ALL the comments so I can look for trends that might help assess where we can make improvements to the experience, or where we’re really succeeding. - PPC Group
Again, all three together. The impressions is a simple check for “is this delivering to people” – the CTR I compare to all other campaigns – generally if it’s under 1% I’ll be worried and look to improve it. If the CPC is high compared to all other campaigns then I’ll take a look too – generally under £0.10 is okay. I’ll also look at this in relation to conversions through our google analytics – identifying the source/medium and then how many of those clicks turned into money.
It’s not a perfect art because it’s really easy to mis-attribute clicks, but it gives a comparative guide to success. I also read the comments on the ads for feedback – e.g. “this looks shit”. - Mailing Group
I’m interested in response rate (RR) primarily – ticket values differ across our programmes and shows so ROI can be a little misleading – the RR is a useful guide as to how well we’ve targeted and how good our letter has been. Again looking at lots of comparative data rather than on its own. - Bounce Rate
Really useful – if it’s high it can suggest website problems, poor content or poor targeting of digital ads. I’ll tend to look at bounce rate by source/medium firstly in comparison to the site average for that particular source/medium, then test the website myself (on desktop and mobile – invariably if there’s a problem it’ll be on mobile), and also read the copy to see if it’s dynamic, has depth and, crucially, is interesting. - Page Load Time
This is a weekly report I have – anything that’s slow loading I’ll take a look at because slow loading sites = less sales. Usually it’s an image that’s too big which is a quick ‘n’ easy fix. - Sales Pacing (AKA the obvious one)
This is the most important thing out of them all. Knowing where a show is in its sales cycle compared to other similar shows in a similar slot is vital. If it’s ahead of comparative shows and has lots of availability and a good deal for the theatre then it might motivate me to invest in trying to get more sales as it clearly excites people and we could make some money on it. If it’s on track then I tend not to worry too much other than double-checking the campaign plan (and often the comparisons to see if there’s hidden danger). If it’s behind then I’ll look at the % of new audiences currently booked compared to other shows, then the campaign plan, then, well, probably everything else on the list. However I always check the deal first and prioritise the shows that have the biggest financial impact for the organisation.
The comedy club call back
Remember that comedy club we talked about earlier… Here’s a starter-for-ten for how we might take a really data-led approach.
As a reminder:
Your venue has a regular comedy club that runs monthly. Sales have been in a prolonged slow decline. Booking is late, often on the night. You’re told the night is good. Sometimes there’s a night that sells out, but it’s increasingly rare. Bar sales are poor. The show finishes at 11pm and sometimes later.
Data points to examine…
- Read audience surveys to see if the night genuinely is good – separating out first time and repeat bookers. Identify which gigs got the best response and whether there’s any commonality with the comments. Then group the comments into ones you can investigate further and go to the gig and just look at it in relation to that. If you don’t have enough responses then an extra incentivised post-show survey or even a FOH sticker based tally chart (put a sticker on how you rate the night)?
- What’s the average bar spend per head for all shows – if the average spend per head for the night is lower then why – it could be day of the week (ask people in the survey?), problems with the bar getting overcrowded (make the interval longer, operate a bottle bar only with reduced range).
- Check which sales channel people are buying on – is there all the right information to lure people to book early (typically many comedy clubs confirm their line ups really late) – is the webpage bounce rate high? Does the page load quickly? Have any of the pages for your monthly night performed better than others? If so, what’s the difference? Does your pricing motivate early booking?
- Are you running digital ads for the event? How early are you running them in relation to the start date and what’s the CTR and CPC? Can you A/B test the artwork for a better response.
- Do people leave before the end because it ends late? Count the people who leave 10, 20, 30 and 40 mins before the end? Count them? An exodus usually means it’s too late. Particularly problematic because Comedy Clubs usually have the best act on last.
- Are the numbers gradually dropping or have they taken a single quick slump? Then look for things in the survey but also potential correlations. E.g. if the price has gone up did that impact the audience numbers? If so how much?
- Is the audience local (within a 15 min drive time) or more wide spread compared to your overall audience? If local is there any specificity you can add to the advertising (“acclaimed comedy only 10 mins from your doorstep”)
That’s the tip of the iceberg.
And almost finally…
I’m back to work this week and I don’t (right now at least) have the same feeling of dread. Instead I feel like the thinking and taking time (admittedly on holiday) to think about this sort of stuff has given me a bit of clarity.
And actually finally: An offer of my time.
I offer this periodically and no-one, to date, has ever taken me up on it, so here goes again.
If you do arts marketing for a venue, need a helping hand, a friendly ear, or are having a shocker of a time with sales and want to talk to someone who’s had the same in the past, and would like, for free, 1 hour of my time to have a zoom chat through anything I’ve written about on my blog (either this one or past ones on pricing etc…) then tweet me or pop a comment below.
To be clear, I’m not a consultant or an expert, but I also don’t have anything to sell and have no intentions (at least for a year or two) of doing consulting in any sort of paid manner. So yeah, the offer is there 🙂
Night x