I’ve been writing arts marketing blog posts for what feel like a long time now.
I decided in my 2023 New Year’s Resolutions to make a few changes to how and why I write them. Increasingly I felt like I wasn’t saying or doing anything particularly original – instead merely regurgitating some version of what the latest marketing fad or trend is, albeit with lots more jokes and possibly more accessibly than most similar blogs.
In 2020, in the midst of the pandemic, when we were all reaching around in the dark searching for potential salvation I felt like my content was more original and, pertinently, useful. I think I felt able to do some problem-solving, proper thinking to try and resolve the issues surrounding Covid and ticketing. Now we’re in 2022, and, well I’ve gone a bit stale.
Also… I keep going to virtual seminars where I want to put a fork in my eyes.
There are immensely smart people talking, giving insight and advice, and, mostly, they’re saying smart things, but everything comes at a price. Do you ever go to these events and think they’re giving you just enough to tempt you in but then leave you tantalisingly unfulfilled and unable to make substantial change without paying a shitload of cash?
For reference if I ever write a book about arts marketing it will be called “Tantilisingly Unfulfilled: A Shitload Of Cash”.
So I wanted to write something useful. Something that you, the tired, exhausted, overworked, but inexplicably attractive arts marketing manager/officer/professional, working in theatre, can actually use.
This is a Power BI file for theatres and Spektrix users that might actually make life easier…
Introduction to Show Search
Let’s start by imagining a scenario.
You’re sat in the office and your programmer or Artistic Director comes over and tells you they’re thinking of booking a show and they want to know what you think.
Will it sell well?
Will it bring in new audiences?
How should we target it?
I’ve been asked this loads over the years and, to be totally honest, I’ve fudged it at times. I’ve never had the information at my fingertips – or had the time to run 50 reports about comparative shows – or had the right report ready to go.
Sound familiar?
We often rely on our memories and anecdote when making decisions on booking shows and how we programme our spaces. Of course much of programming is guesswork – it is rare we have perfectly comparable show – we’re not comparing Coke Zero with Coke Zero, we’re often comparing Coke Zero with Rum & Coke, or Coke Zero with Fanta, or Coke Zero with San Pellegrino Orange (Tory Fanta).
But that doesn’t mean that we can’t try to look at similar events to see what they did for our organisations.
I toured a show last year and my memory of when I played my home venue is that it sold out. Alas reader it did not, in the cold light of data, when I check the sales report I can see that actually sold poorly (if you’d like your venue to have my next very-good-but-poorly-selling storytelling show then click here).
Our memories are deceiving.
I’ve sat in programming meetings where having key data can help us start to make smarter decisions and mean we’re fudging our responses less. The problem is that it’s hidden, hard to access and slow to load. We use Spektrix, it’s a pretty nimble system, but consider how long it takes to get all the reports you need to answer these questions:
- How many tickets did we sell?
- % of first time visits
- Number of bookers
- % capacity sold by instance
- % capacity sold by event
- Number of complimentary tickets
Let’s give the benefit of the doubt and say 5 mins. Not a long time right? What if we look at that data and want to add in 3 others shows? How long now? And if you want to know the aggregate rather than the shows individually?
The speed with which we can interrogate data has a direct correlation to our organisational efficiency (I think – I clearly have zero evidence for this…).
We’ve been thinking about this a lot at Theatr Clwyd so we’ve been using Power BI to answer questions about our data, in a faster way than ever. I’m not sharing our full Power BI file, (it has 25+ pages of multiple analysis points), but instead sharing our first page – the one I use in programming.
It might just save you a little time and be the start of a journey to explore your data more fully.
What is Power BI?
Power BI is Excel on steroids. You use it to visualise and interrogate data so you can understand your data and trends more easily. It also works on big data sets – so whereas excel will make you laptop explode with 1,000,000 rows of data, Power BI will merely shrug and ask for more. But crucially, if it’s set up well then it’s super fast!
Essentially the tool we’re sharing today is this:
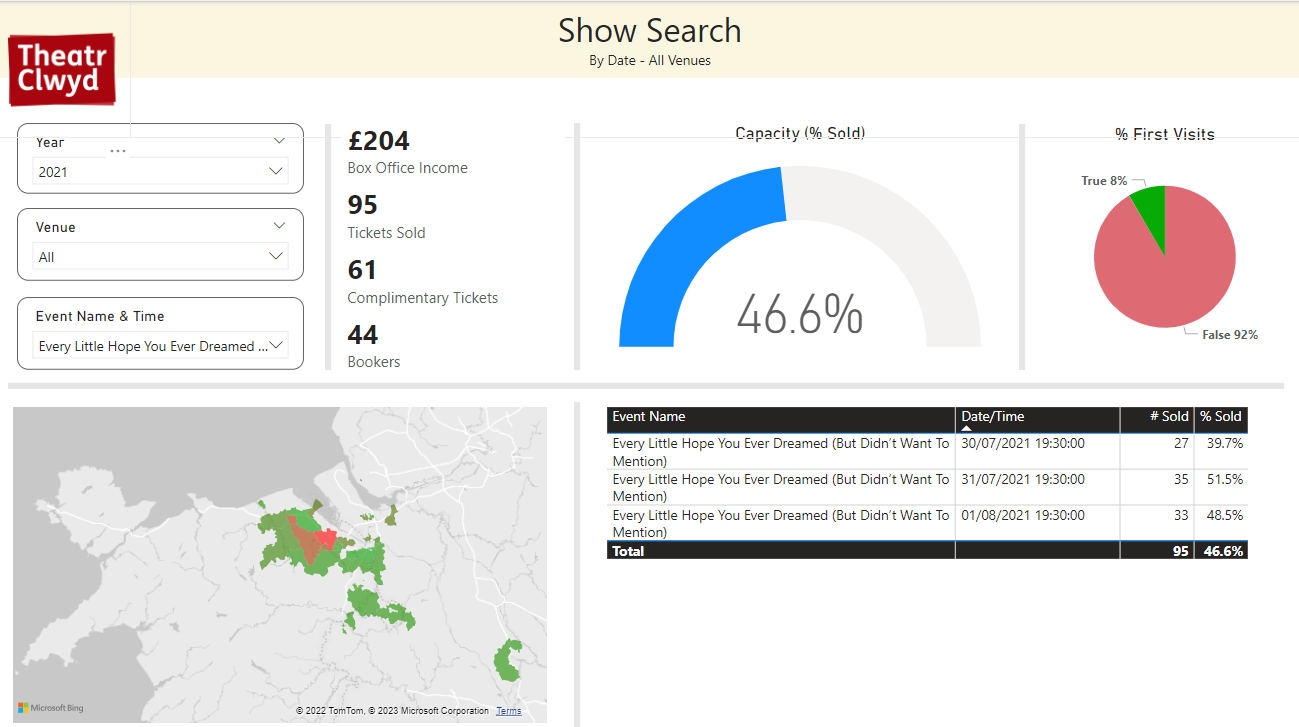
It’s a near-instant way to get all this data on a show… This data is real by the way and, crucially, from my show which is why it’s okay to share. So we can see income, tickets sold, comps, bookers, % capacity sold, % first visits, sales by instance and a cool heatmap.
Of course context is really important with these things… So before we progress any further let’s touch base on the limits of what this does. It gives you the briefest of overviews very quickly – it doesn’t give you extra layers of depth (in the version I’m sharing), but allows you to get your key data super quickly for when you’re in a heated moment in a programming meeting and someone says “that sold well” and you disagree.
But there are limits.
Looking at the data above you’d mark this down as a failure. It sold 47% of capacity, not many new audiences and loads of comps. Also box office income is appalling. But…
- This was under 2m social distancing in Wales in 2021
- It was a useful testing event for doing events indoors
- It was given as a free show to Theatr Clwyd members.
- The show was a) astonishingly good and b) a preview/work-in-progress
That context changes a failure into, well, less of a failure.
Power BI is attached to a lot of people’s Office 360 packages so there is a fair chance you’ve got it available on your PC already or as part of your organisational package. If not then you’ll need to get it – it’s around £7.50 a month as an add on which, if you’re a geek, is well worth the money.
Okay, let’s do this!
So you’ve got Power BI installed – I’m going to talk you through how to make all this work. It only works with Spektrix data at the moment BUT if you can match to equivalent fields in other systems then it should also work fine (but it might be a pain the the ass).
Read this full blog post before starting!
Step 1 – Download the demo files
- Click this link to go to the Google Drive – there’s a zip file called “Show Search For Power BI” – download this file and unzip it on your desktop!
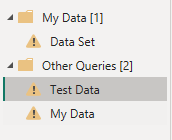
- Inside it are 3 files:
- Show Search v1.2 – PowerBI file
- My Data – csv file – this will be replaced with your data
- Test Data – csv file – this helps it work
- Open up the Show Search v1.2 Power BI file (it might ask you for an e-mail address – I just click cancel)
- You screen should look a little like this…
Step 2 – Reconnect and Test the demo files
- You might have got an error message when you loaded the demo files – that’s nothing to worry about – it’s most probably that you need to relink the two csv files.
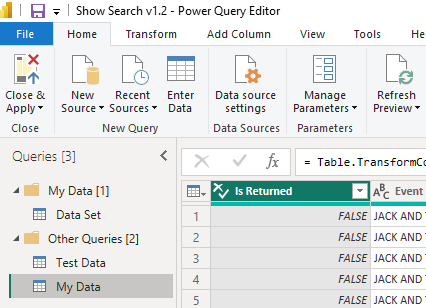
- Click “Home” and then “Transform Data”
- Your screen will look something like this…
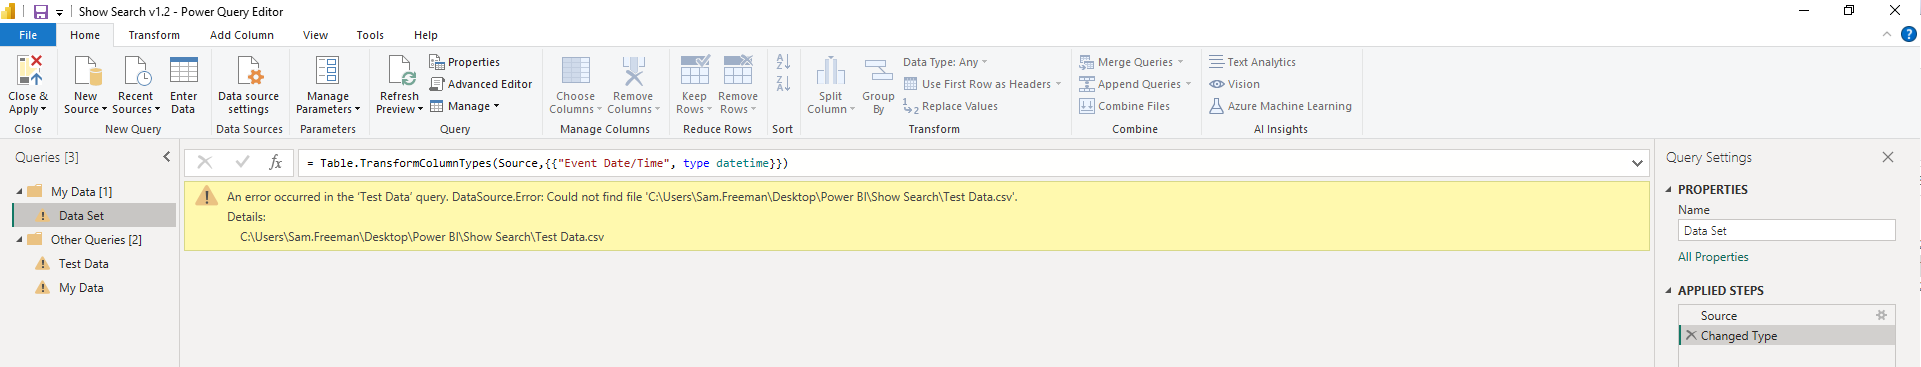
- There are lots of scary looking triangles and warnings. STAY CALM!
- On the left hand side click Test Data – it looks like this…
- When you’ve clicked it we’re going to relink the files.
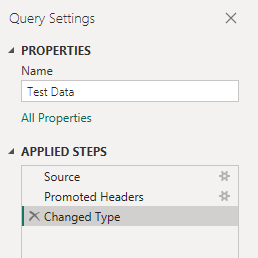
- Over on the right hand side click the little gear logo that is to the right of the word “Source” in “Applied Steps”…
- It’ll open up a screen that looks like this:
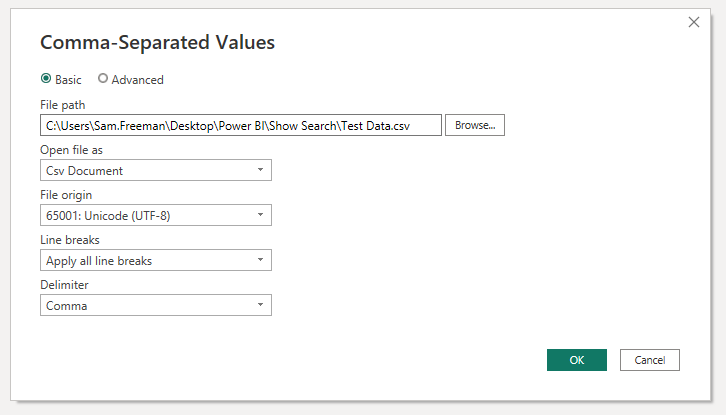
- Click the “Browse” button then find where the Test Data.csv file is saved on your desktop. When you’ve found it click “Open” and then “OK”.
- That’s the first file relinked. Repeat that process for the My Data.csv file – relinking it!
- When you’ve done that click “Home” then “Refresh Preview”
- The files are now correctly connected.
- If you want to check this has worked click “Close and Apply” in the top left and after a bit of whirring Show Search will be working. There’s no data in there apart from a test show, so now we need to get and add your data!
Step 3 – Create a new Spektrix report
- I’m going to assume you know how to make a brand new Spektrix report… If you do this bit will be easy if not then really hard… You could ask Spektrix if they can take a copy of the Theatr Clwyd report called “Power BI Show Search” on to your system. You can say Sam says it’s fine…
- A note: Sometimes Spektrix crashes when setting up analysis reports. If it happens then set up the search criteria and then one of the output columns only. Then save. Then reopen and add the rest… You’re welcome.
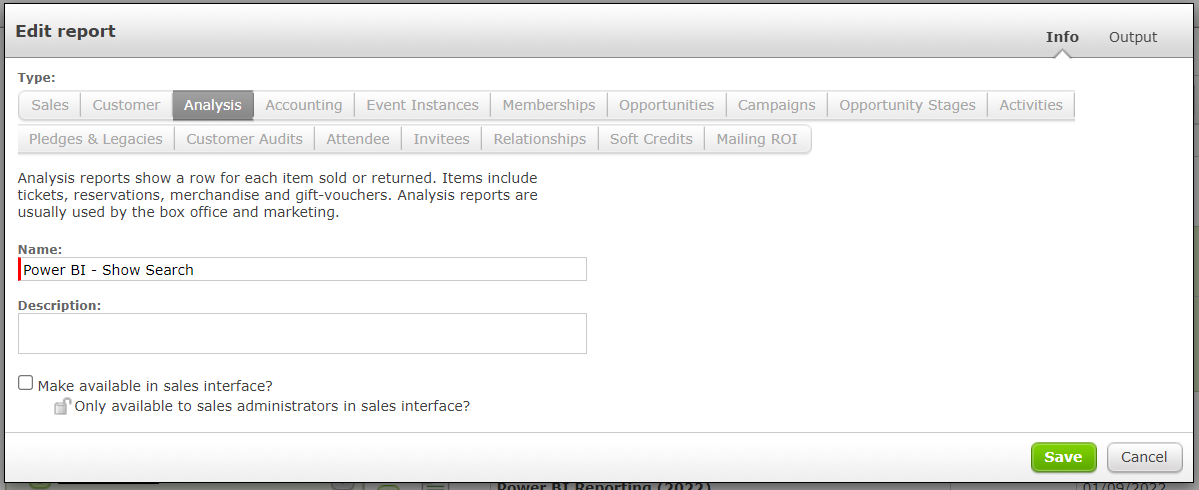
- This is the report you’re making – try and make it exactly the same or you might have issues… It’s an Analysis report (which is very important).
- And then with the following Criteria…
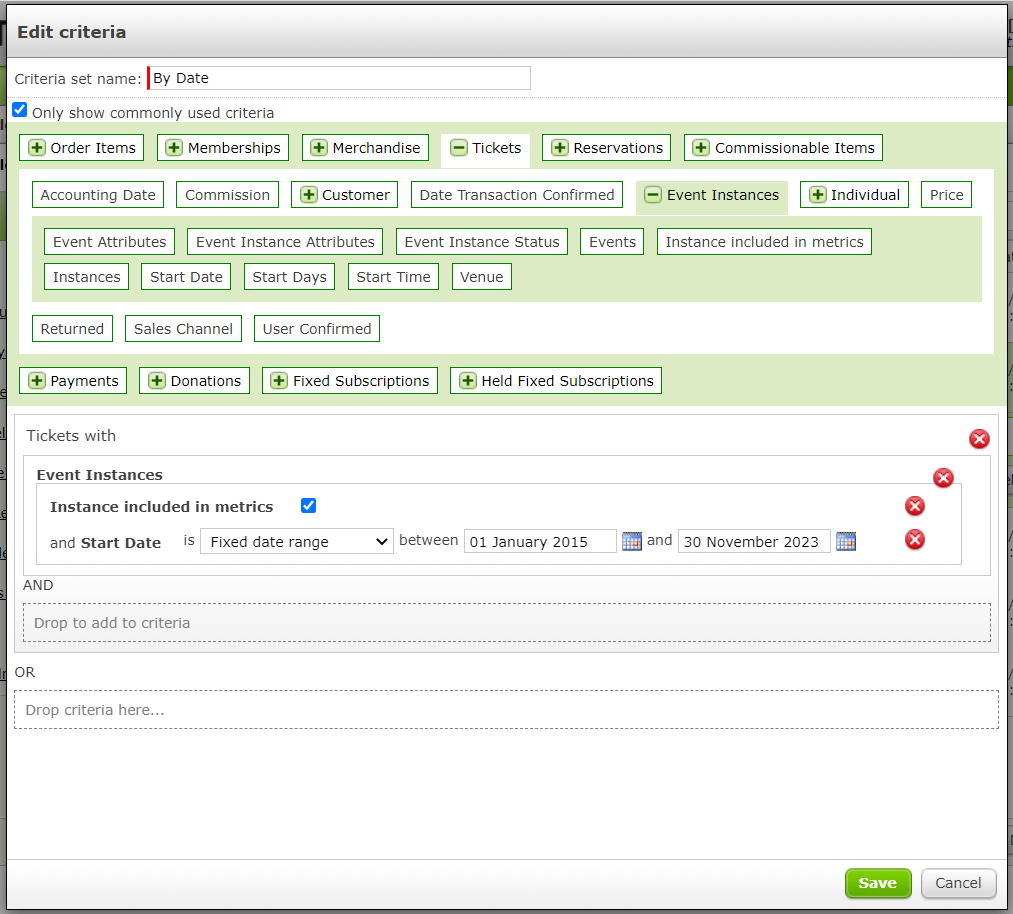
- And finally with these outputs (do them in this order please, and you’ll need to unclick “Only show commonly used columns”)
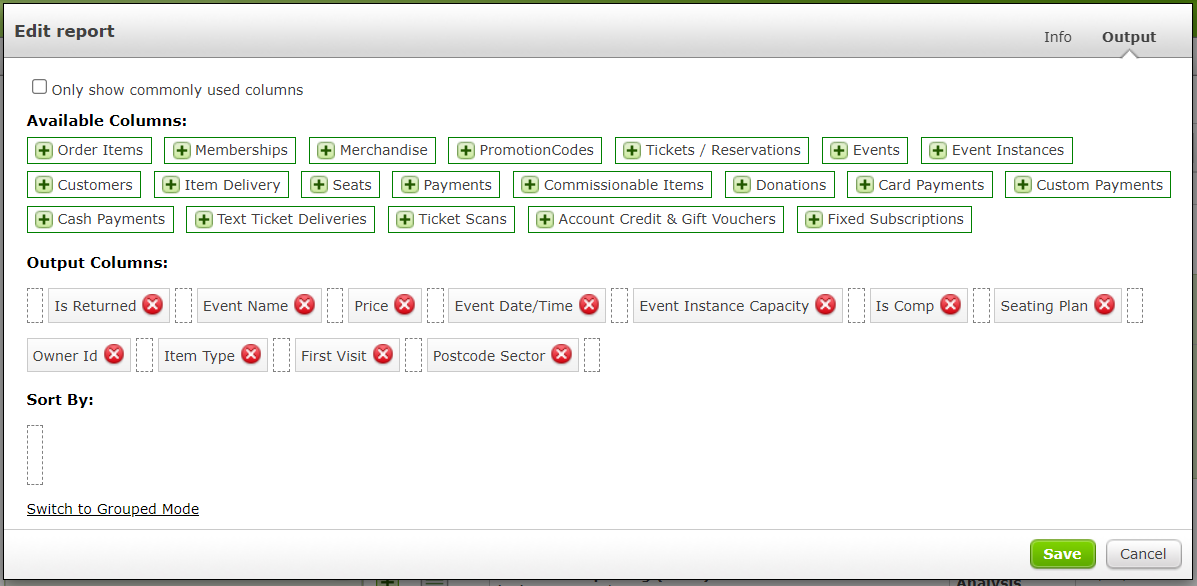
- Now click Save!
Step 4 – Run the report and get your CSV file data
- Run the report – the date range you put in will be the date range you’re able to access in your system. You’ll be able to refresh it every couple of months to keep it up to date. Bare in mind if you pull in future sales then it’ll only how sales were at the point of running the report.
- Also don’t forget that if, for example, you select Jan 1st as your start date then you might only get performances of Pantomime/Christmas show, that happen after Jan 1st!
- Run the report as a CSV file (it might be quite big.. 2015 to 2023 for me is 142mb.)
- When it’s downloaded rename the file “My Data” – so that the file name is identical to the one you earlier relinked…
- Copy and paste this new file in the folder where the old “My Data” file is found. You want to replace the old file with the new one!
Step 5 – Refresh the data
- In PowerBI click the Home and then “Transform Data” button again (unless you’re already in the Power Query editor screen, in which case hold on).
- On the left click on the “My Data” tab and then click “Refresh Preview”
- You should see that the data table is now filled with all your show information!
- Click “Close & Apply”
- Nothing will have changed (yet)… Finally click “Refresh” and hopefully…
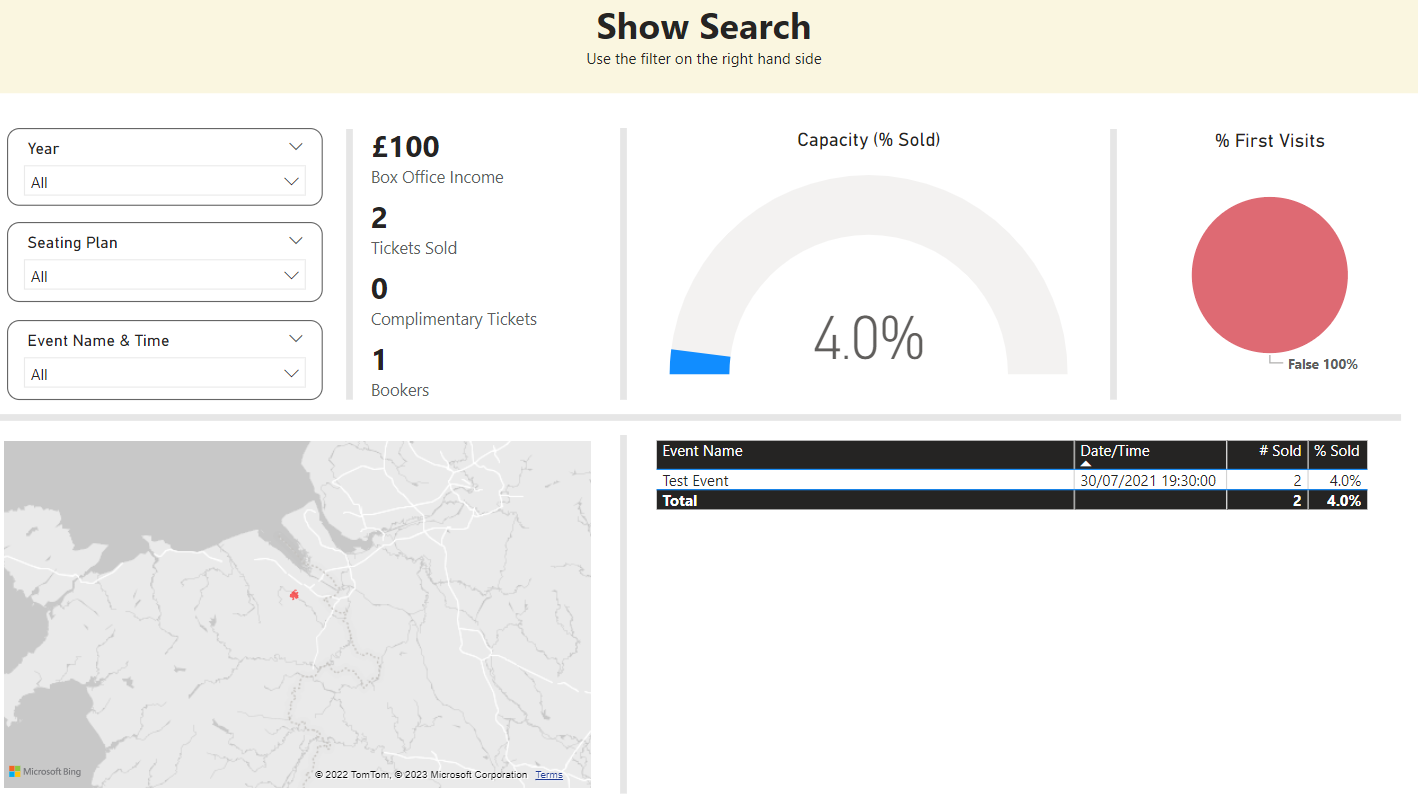
Step 6 – See if it works…
Now the moment of truth.
Your data should refresh and you should be able to interrogate your data… Have a play with the filters to start with – it will initially show ALL your data, so the simplest starter for ten is to select one show… If you have LOADS of show as we do, then narrow down by seating plan or year first!
If you’ve any problems then double check the steps above. It goes without saying that you’re doing all of this at your own risk and if it doesn’t work then I probably don’t have time to help BUT it probably should work…
And finally…
If this works and it’s useful in anyway then do the following (or just do them anyway):
- Send me a tweet @MrFreeman1984 and let me know how you get on.
- Join my mailing list as I sometimes send this sort of stuff there first! Click here to join or for my contact details!
- If you work in a theatre with a nice studio space and room in July then pass this link to your programmer… It’s a great show, I’m in it and wrote it and, frankly it’s both cheap to book (and the tour booking is going badly so far).
- If you want a chat about arts marketing then drop me a line – I’m not a consultant or expert, but I am a Head Of Marketing with a mostly friendly ear.
Cheers & Good Luck