In the last Marketing DIY post (here) we talked about how you can do a basic heat mapping of your auditorium. We took basic data contained within your database to look at how long prior to booking people actually booked their tickets, used this as a basic measure of demand and then mapped it using conditional formatting to get an insight into how the booking of an auditorium works. Simple, not perfect, but useful.
But what do you do next? I gave a few examples of ideas you might have to increase revenue, but there’s probably more data you need to examine (particularly in regional reps where you have a broad variance in programming) before you should make your decisions about how to do your pricing. One example, which I’m going to touch on here might be variance in genre.
Let’s start with our hunch. I go to the theatre a lot and know that the experience of going to a comedy night varies from a theatre show – some people just hate that direct contact, they want to avoid being “picked on“. Equally, I have a suspicion that families always want the front row and that, in a rather more silly example, for circus shows that people love the side seats. So far, just a hunch, so how do we test it?
For this example for ease of explanation and to make it a little easier to write this blog post I’ve created some data based on an entirely fake 9 seat venue called “Sam’s Theatre”. The venue has had 4 shows in this example – comedy, drama, dance and physical theatre.
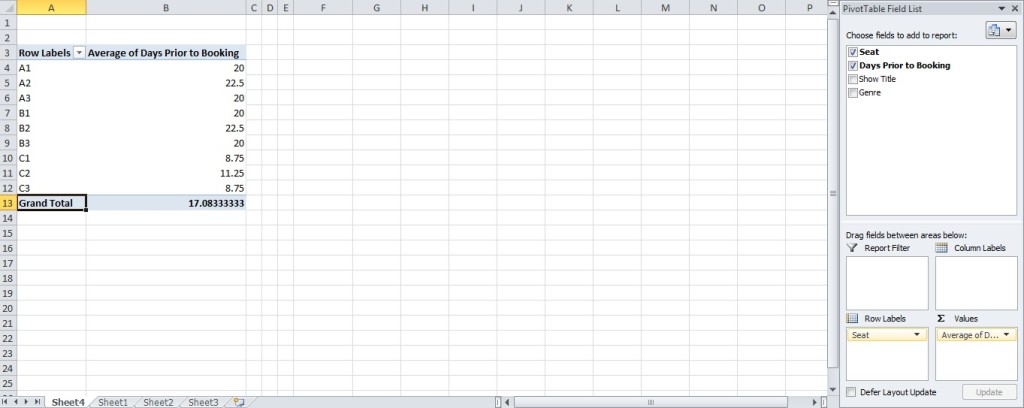
In my sample data the addition of the genre column (which is an event attribute) means that we can start to slice and examine the data in different ways. Our first port of call is, like in the previous post to put the data into a pivot table. As you can see on the right we have our fields of information, so by row we’re looking at the individual seat (this is what we use to build our heatmap). The values we’re looking at is the day’s prior to booking – in the values box there’s a dropdown called Value Field Settings and set the Summarise Value Field by Average.
So we’ve essentially got what we had before and we can build our heatmap using conditional formatting.
So here’s our heatmap which is the averages of all our data from across my (admittedly limited) four show season. What we can do next is use a tool in the pivot table to examine the data in different ways (pivot table tools > options) called the slicer. This allows us to look at slices of data. In our example above we have currently two unused columns of information – show title and genre. The effect is to only look at portions of data and to give us a visual representation of what is happening.
So let’s imagine that we’ve used a few years data, across multiple shows. Now this information becomes useful in setting pricing going forward and potentially identifying where demand might be, where price boundaries are and how we can increase yields. Conclusions in this example might be:
- Comedy: Could we increase prices of middle row and reduce back row price?
- Dance: the side seats are less important, can we reduce prices of these, or should the middle be more expensive?
- Drama: 3 price bands might be a good idea? Perhaps we could look at then how we incentive customers to trade up?
- Physical Theatre: the back row could be cheaper but no point discounting the sides?
This, as I’m sure you’ll realise, a really brutalist and unsubtle example.
Even when using much bigger data sets it’s important to bear in mind the many other factors to look at when examining pricing. How does it fit in with brand, organisational ideology, programming etc… There’s also things like clarity for an audience, organisation, staff, maybe there are errors in the dataset, perhaps there was one show where seats were booked consistently months in advance. As a result this should be a guide rather than a definitive answer to all pricing questions I think.
This is all the pretty basic end of what’s possible to look at and explore – if you’d like to know more, bounce ideas or even a little bit of (and I’m loath to use the word) consultancy, then drop me a tweet @mrfreeman1984 or contact me through my contact form (or at darklaughs(at)outlook.com).
Best, Sam


