
A horrific injury
I cut my thumb open cutting an onion this evening.
Blood absolutely everywhere.
Carnage.
I was making a lovely Indian dish (recipe stolen from Gusto) with finely sliced onion. What makes it worse is that I was doing the chef impression that I do when I think no one’s looking. You know, the one where you narrate what you’re doing as if you’re James Martin on Saturday Kitchen.
“Here we are finely slicing the onion and now… fuck shit bollocks.”
I’m saying this so that you understand why this blog isn’t the usual fun-fest that you, dear reader, have come to expect. I’m wounded, so don’t have time for the usual jovialness, I might not have long left*.
A thing I made with Power BI
I’ve been playing with Power BI lots recently to try to visualise Theatr Clwyd (where I work) data and make it easier for us to know what’s going on. Originally when I was doing data analysis pre-pandemic I was using Tableau, but moved over to Power BI because, well, it’s free – it comes with our Microsoft package at work. As it turns out it’s much easier than Tableau once you get the hang of it because basically it’s hard-core Excel**.
I’ve reached a point where it’s nearly as good as what I made in 2020, so I thought I’d share some visuals so you can get a flavour of how and why it can be so useful. I’ve only shared about 1/5 of the sheets I’ve made and the data is heavily redacted, but hopefully it’ll inspire some ideas.
Why use data visualisation software?
Before we get into the pretty graphs section though it’s worth saying why do this. After all if you’re going to invest time, effort and a little cash in this then you need to know it’s worthwhile.
Here’s my top reasons why I think it’s good.
- Speed
It’s quick. Yes it takes a long time to set up, but when it works it does instant reporting. Imagine doing reporting on a show – you want the basics – number of performances, tickets sold, % new audiences, value of tickets sold. How long does that take to run. Maybe 5 mins if you’ve got the report ready already? Chances are that’s not one simple report, but three? On power BI once I’ve made the report I can run it for ANY show or combination of shows in under 10 seconds. - Flexibility
You can create anything but you can also mix data sources – you could pull multiple sources on to one page – again when it’s made it’s instant to interrogate the data. You can look for cause and effect across multiple factors really quickly. Does “% new audiences” and “% capacity sold” have a correlation – then find out – need to change “% new audiences” to “people from Rhyl” – then find out if it makes a difference***. - Big Data sets
Why not use excel. That’s the cry right? And excel is great to a point. But the data I want to look at is 10 years of line-by-line sales data, nearly 6 million rows and 62 columns of an excel spreadsheet. I tried to open one of the files in excel and my laptop sent a warning to our IT Manager telling him my laptop was about to explode (I’m reliably informed that my laptop is a frequent offender for getting too hot from running too much shit at once). - Visualisation
It’s far easier to tell a story if you can see a story. But stories are, of course, layered – there are twists, turns and caveats, you can tell a story more effectively. How you read that story is, of course, up to you.
Sales Data – Example
I’ve split my examples into sales data (in this case extracted from Spektrix****) and then survey data (from Jotform) – I’ve added a few notes to explain a little what you’re looking at – also to say that I’ve both redacted (like I’m in the CIA) and also mixed up a couple of data outputs, so no this won’t give away all of Theatr Clwyd’s trade secrets*****. The annotations for each image are UNDER the image.
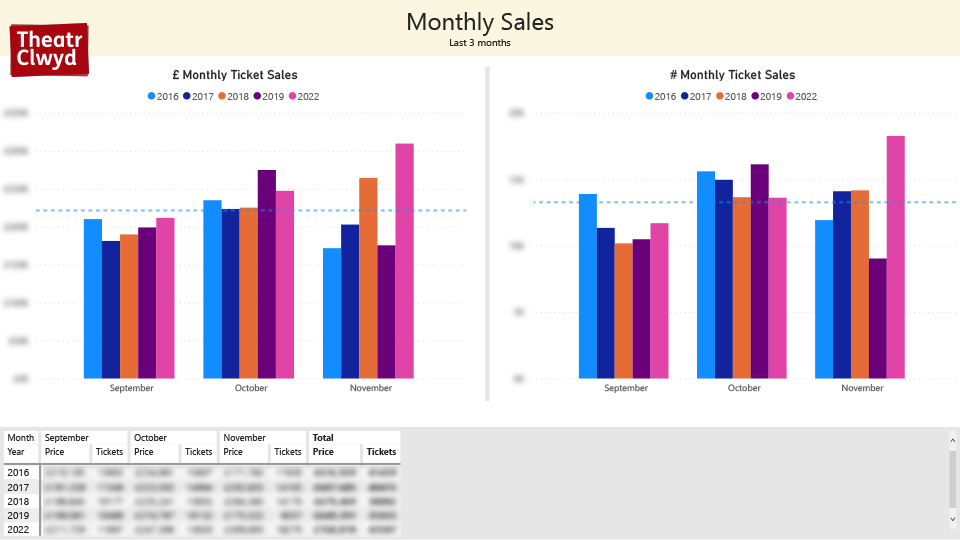
Monthly Sales – So this looks at all sales for a specific selection of events in venues that we run to look at monthly, year-by-year comparisons. I’ve taken out 2020 and 2021 because, well, they were terrible due to covid so only really tell us that they were terrible due to covid.
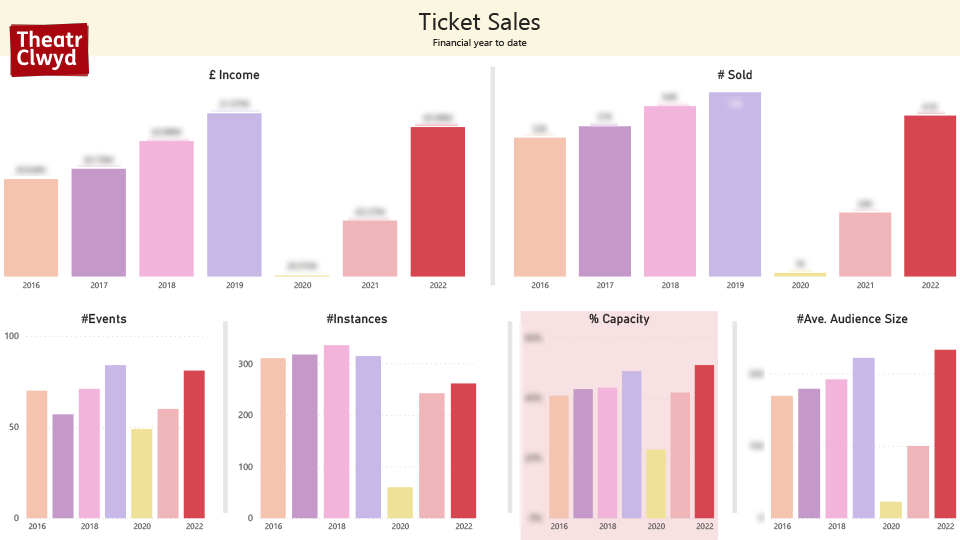
Ticket Sales – A bit of a generic dashboard for ticket sales looking at the financial year to date. You can instantly flick between different venues, or genres with this. I left in 2020 and 2021 (it was dire). One challenge that I’ve not solved is how we did pod seating in 2020/21 (e.g. buy one ticket but for 4 people) for our outdoor stages.
Less of a problem in this particular comparison because I’ve removed the outdoor venue from the equation.
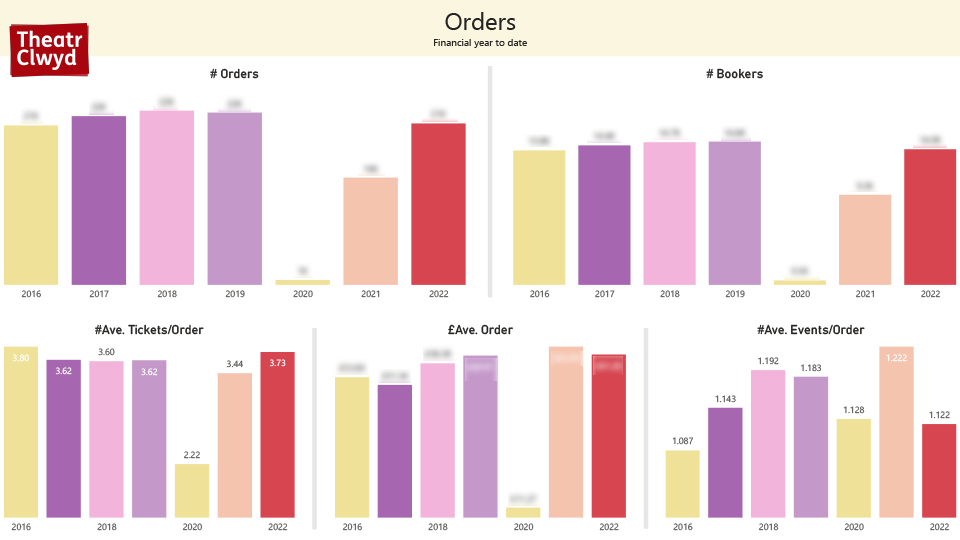
Orders – This looks simply at orders. The bit that’s most important for me in this one is the bottom right. It’s where Spektrix falls down for me a little – the in flow upselling isn’t set up right for us at the moment and it’s going to be a big thing for us in 2023/24 trying to hammer this figure both on our website and Spektrix.
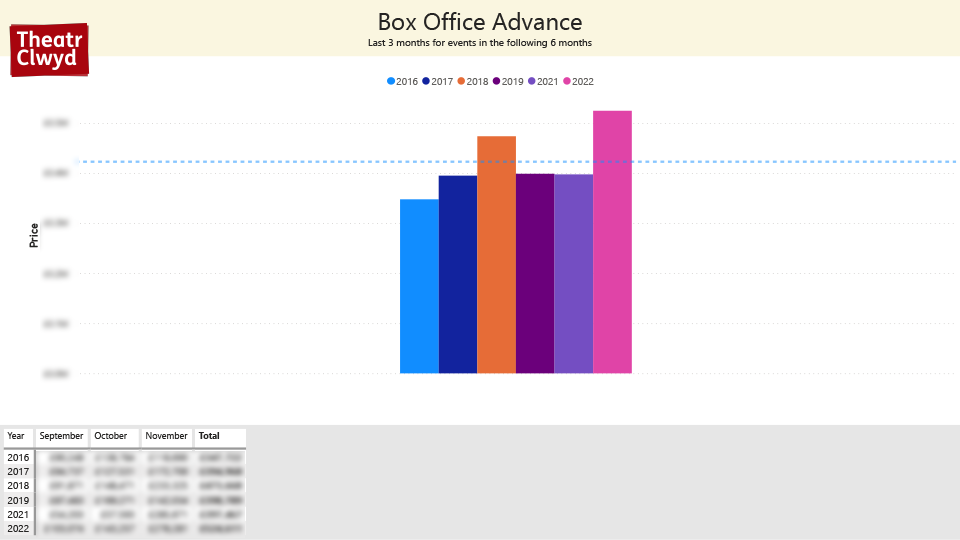
Advance – I wanted to know how our advance looks based on the previous few months sales. You can change the reporting period very easily. Ours is slightly pushed by marginally later panto sales and also an unexpected glut of school bookings. The Spring still looks okay but it’s probably on the average line rather than vastly above. It’s, of course, easy to test this theory, by adding a filter that removes our pantomimes completely.
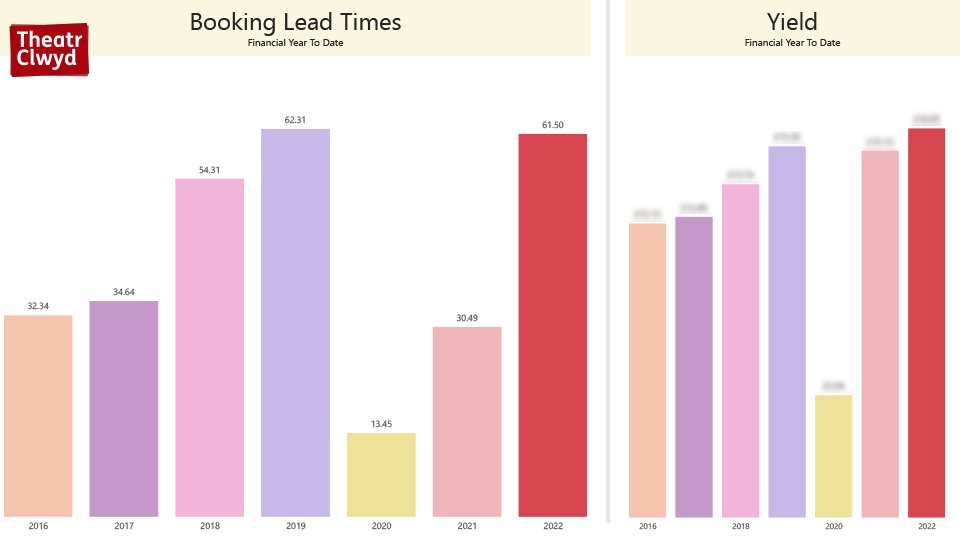
Lead Time & Yield – The earlier audiences book the better – we manage our resource substantially more effectively if that happens. 2020 and 2021 saw our advance booking crash – understandably as our lead times for events going on sale were vastly late. What’s reassuring is that 2022 looks like a recovery. It’s probably a mixed picture though – again Panto makes a difference (it goes on sale in Jan), so those performances will distort the total.
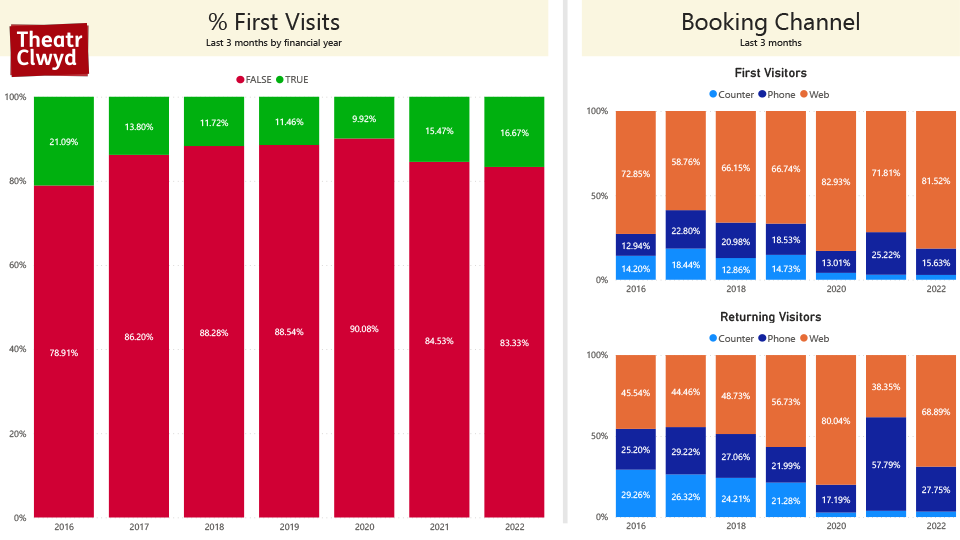
First Visits & Channel – First visits are vital, we have to replace audiences who move or pass away. This helps monitor those changes. But also changing behaviours of new and returning audiences. Worth saying that groups tend not to book online which pushes up the % of people booking by phone substantially – you could check that by removing any order that includes 10+ tickets to see the difference.
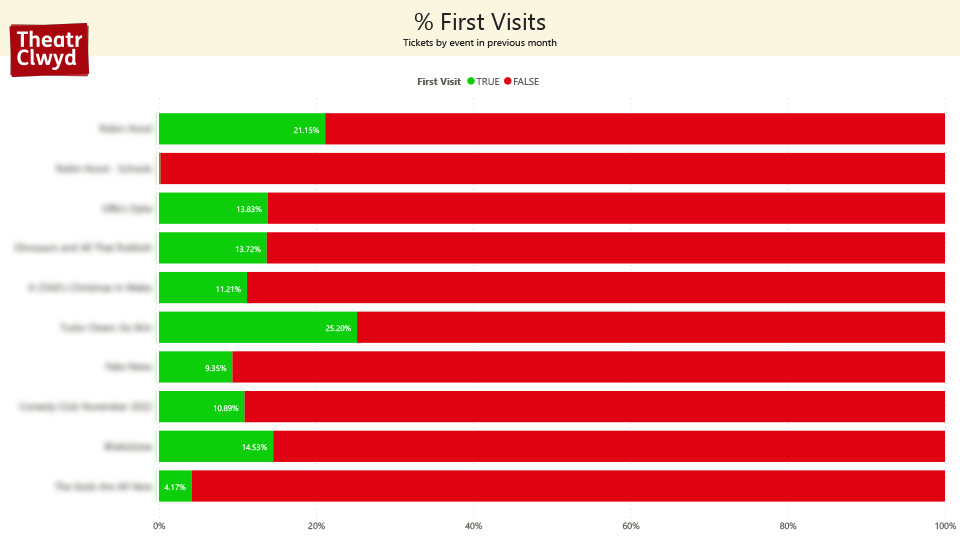
New Visits – Knowing which shows drive new audiences is essential – interestingly the highest green bar in this one is Welsh Language Stand Up Comedy – it poses a question – that event also sold out, meaning we have a very strong case for doing more Welsh Language Stand Up Comedy.
Survey Data – Examples
We survey all our audiences – obviously they don’t all respond – first time and repeat bookers get different questionnaires about their experiences too… We can combo this information with sales data to give us a clearer and easy to visualise and create picture of events in our venue.
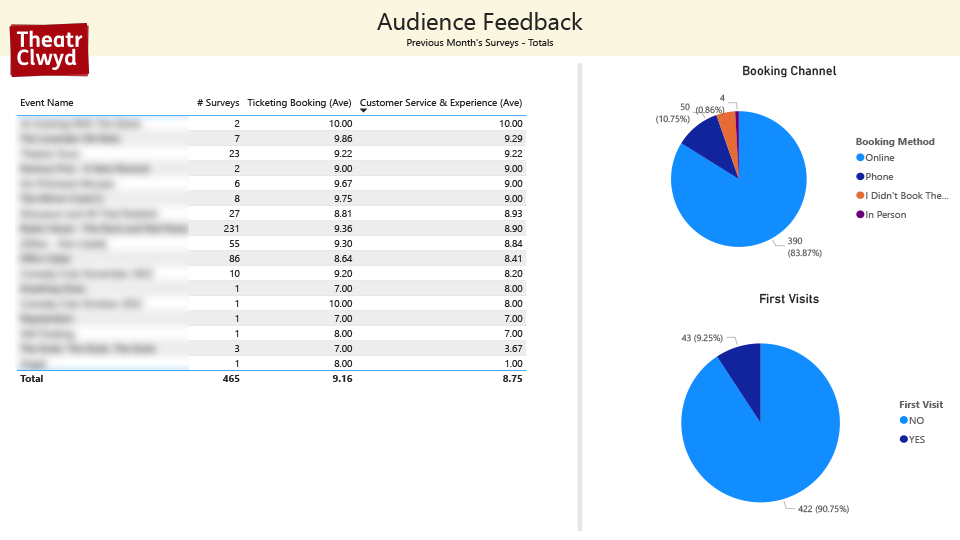
Previous Month Events – So this is our starting point – how did people rate the events we put on. Data sample size is very important – if 100% of the audience hated a show but there was only one survey response then that’s fairly useless, but if 100% of the audience hated a show but you had 500 survey responses then the show was, probably, shit. It’s worth mixing this information with qualitative data – e.g. comments etc… too as it helps tell you the why sometimes (particularly if multiple people say the same thing).
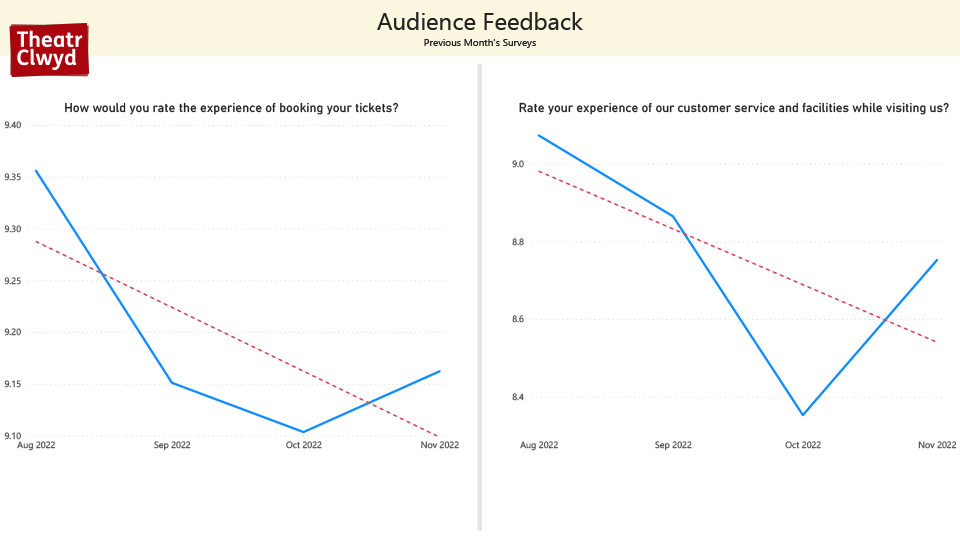
Graphs about how we’re doing – Some of these bigger figures go into graphs. They can be a bit hit or miss (sample size), and are prone to external factors – we had a huge drop off once because it was raining and people judged us for that. But these are to show trends and help stimulate inquiry and not to be the thing that we judge ourselves against. Also note the scales – they’re not all from 0 – 10, the decline is relatively low – certainly well within the range of standard deviation in the full, longer term, data set.
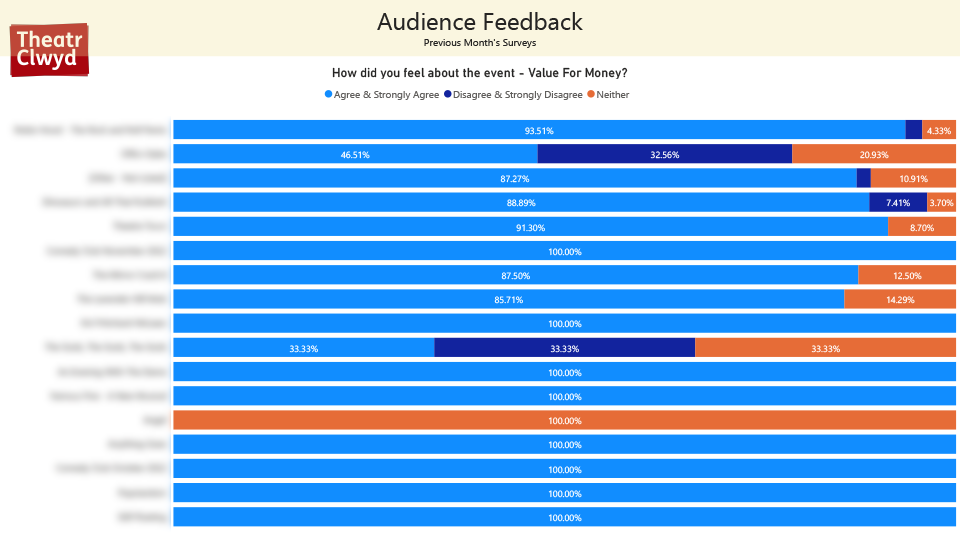
Value For Money – Always a great question. Light blue and orange means our pricing was about right, dark blue represents a potential problem. The two shows above get big dark blue chunks for very different reasons – one is because the audience reaction to the show was very poor (people really didn’t like it), the second is because of a very small sample size. That’s why reading below the top line data is so important so that we make informed and really smart decisions.
And Finally…
If you’ve enjoyed this blog and/or found it useful then please do one (or all) of these three things:
- Leave a comment below
Even if it’s just to say hi – I love finding out who reads this godforsaken blog 🙂 - Tweet me
Click here, tweet me and say hello AND THEN retweet this. Please? Yeah? - Join my mailing list
I’ve never sent an e-mail. The list is currently 20 people – 4 of those are family members and 2 are my test accounts. So, y’know, it’s not going well. Actually, sod that, don’t join, let me keep it exclusive. Schrödinger’s mailing list. It is here.
Thanks for reading and keep well xx
*Just so you know since finishing this blog the bleeding has now stopped, so no need to worry.
**A phrase they disappointingly don’t use in their marketing
***It does not
****GDPR? Excellent question. None of this uses any personal data. You’re welcome.
*****All our marketing is made from an original recipe passed down from generation to generation and refined over time. It’s now locked in a vault marked “secret original recipe”.