
I’ve recently found out that I like gardening.
It’s relaxing, pulling out handfuls of weeds to leave a bare patch of earth looking like the set of Apocalypse Now, watering vegetables that steadfastly refuse to flower or fruit and trying to work out what the hell you do to keep things in pots alive. Two months ago my spade (handed down from generation to generation) snapped in half and since that moment I’ve been using a trowel to try and dig myself out of a metaphorical hole.
I found myself, about 4 months ago, thinking about data in a similar way to my efforts digging the garden. There must be an easier way.
The theatre I work for uses Spektrix (other systems available and will work in a similar way in terms of data export) and, while the reports are nice and user friendly I found myself needing something a bit more, well, spade-like. The issue with reports, particularly PDF downloads, is that they serve fairly singular tasks very well but don’t allow you to really explore and question data, not in a free flowing and speedy manner. You run a report, read a report, amend and repeat. Don’t get me wrong, it’s faster than most other systems I’ve used and is pretty good for basic applications but, greedily, I wanted more.
I was trying to do some analysis on the cinema we run, ask questions of the data to find out how programmes have changed and developed. What’s working and what isn’t and also, how we’re doing to date – better than last year? Worse? The same?
So I started off by downloading a row by row seat sales history for a show – pulling a range of data – from venue, date and genre, to days booked in advance, sales channel and event name. I threw it all into excel and… Well, a massive ball ache. Excel died pretty much instantly. The file size was huge (as an .xls) and the data I could gain from using smaller data samples was barely a step above my starting position.
But I gamely soldiered on, and through trial, error and some excessive swearing extracted some interesting data from a raw data file.
(Full disclosure – I made a fake data set for all the charts in this document – sorry, some of the info in the real ones are sensitive and so I did some mocking up to show you what it looks like!)
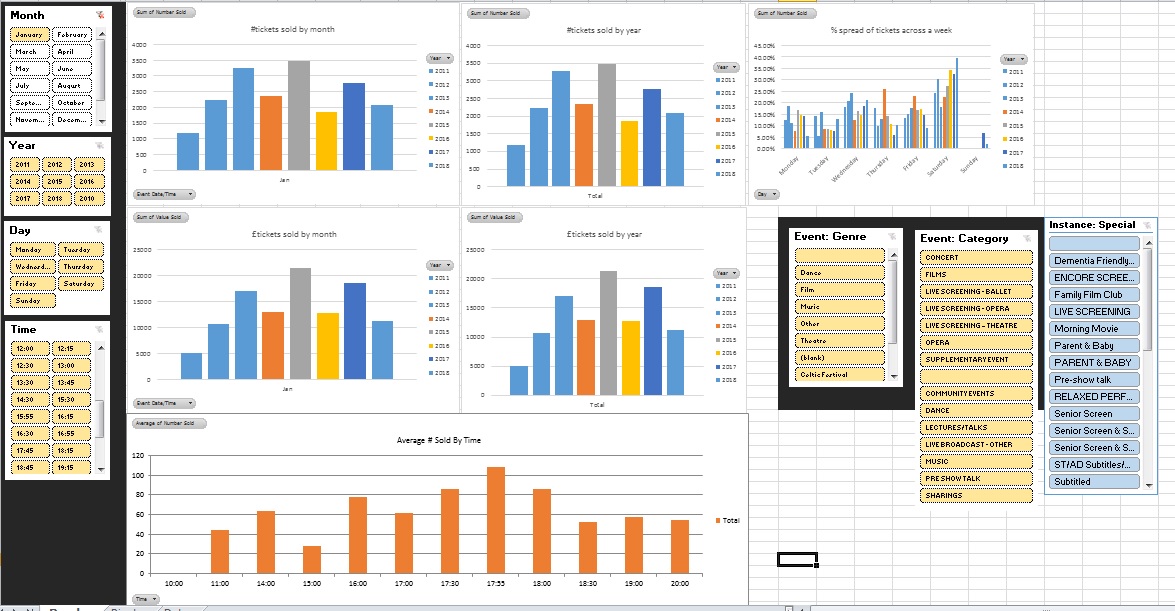
So here’s what I ended up with (filled with a fake data set) – a clever, pivot table powered chart with filters based off a single large data table. So it could filter data quickly, provide answers to some questions and, visually, was workable.
The visual part is important because data is only as useful as its ability to persuade power to change or make a decision. This version has various basic dimensions and metrics but is limited by the cleanliness of the data underpinning it – my ability to make multiple pivot tables work together and also time. This took fucking hours, late at night, time that could be better spent writing blogs about brochures (which you should totally read btw – it won’t be at a conference any time soon and is interesting as a debate starter).
This chart looked at shows on a instance basis (each line is one performance of a show), interesting sure, but not actually that huge an upgrade from old reports. It’s also hamstrung by the challenges of updating and adding data. I’m not a programmer, or a mathematician, or a data scientist – I’m an enthusiastic amateur and geek who wants to make some charts to see if I can sell more tickets.
This table, while a little useful is essentially all just a bit tedious – I thought maybe the problem is the tool I’m using.
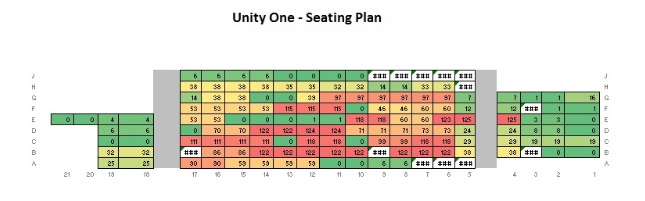 I’ve always used excel because it’s on every computer I use and, well, I’m quite geeky so its always made sense to use it. It can also do some really basic heatmapping (there’s a “how to” – click here – but beware, I did this 3 years ago so if you decide to do it there’s now definitely better ways) and data tables, but, if we’re being data led and trying to make decisions that are less gut reactions then maybe I need a better tool?
Typing in “data visualisation tools” I came across Tableau.
Now, before I start waxing lyrical about this I’d like to say that other systems are available, that while it’s relatively simple to use there is a learning curve and “yes, you should get me to come and show you how it works sometime” (or visit me, much easier, we can go for cake… yum).
Tableau claims to “help anyone see and understand their data. Connect to almost any database, drag and drop to create visualizations, and share with a click.” A bold claim, and, largely a claim that it delivers on.
There’s an important point to make before I go any further too. Why do this?
Everytime I talk to anyone in marketing the resource they’re missing is time. Not budget, or inspiration, or creativity. Time. We, as an industry, need to look at how we make efficiency savings, a minute at a time to allow us to do the jobs we’re meant to, to find time to make that difference. Our 40 hours a week needs to work harder and smarter.
Lecture over.
Tableau allows you to import a CSV file and then simply drag and drop dimensions and measures into visualisation. I currently have a CSV file that has nearly 1.5 million lines of data that is a) easy to update and b) is powering about 30 different, instantly update able and explorable graphs and charts.
I was originally going to go through a step-by-step process of what I did but instead I want to show you the results and talk through what they do… If you want to give it a go then please do (there’s a trial version of tableau available for free) and if you want to chat about it with me then drop me a tweet (@mrfreeman1984).
Here’s some of the things I’ve made – all easier and fast to filter… (I made a fake dataset for these too…)
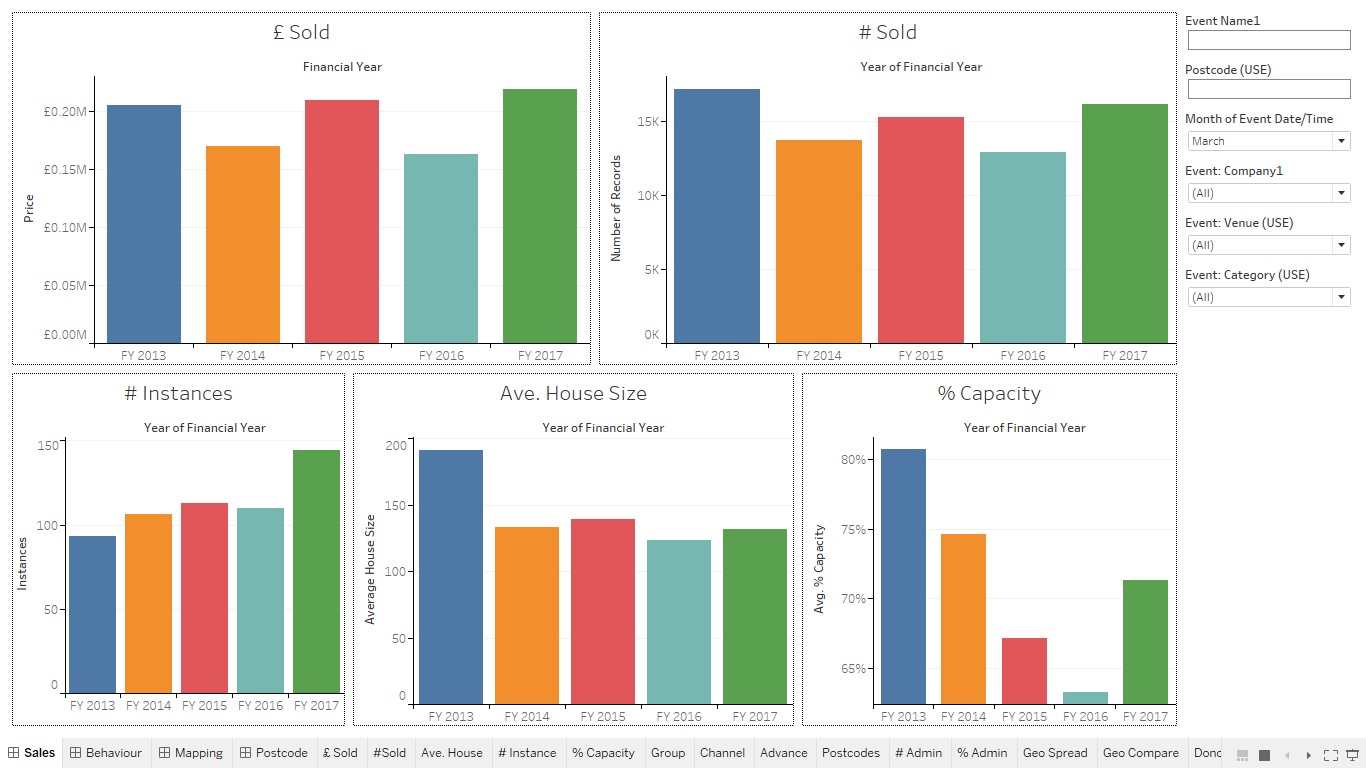
A basic sales dashboard, that can look across any venue, show, genre, date, time etc…
Q – how quickly can you find out average capacity across a series of shows, year on year? I can do it in 14 seconds…
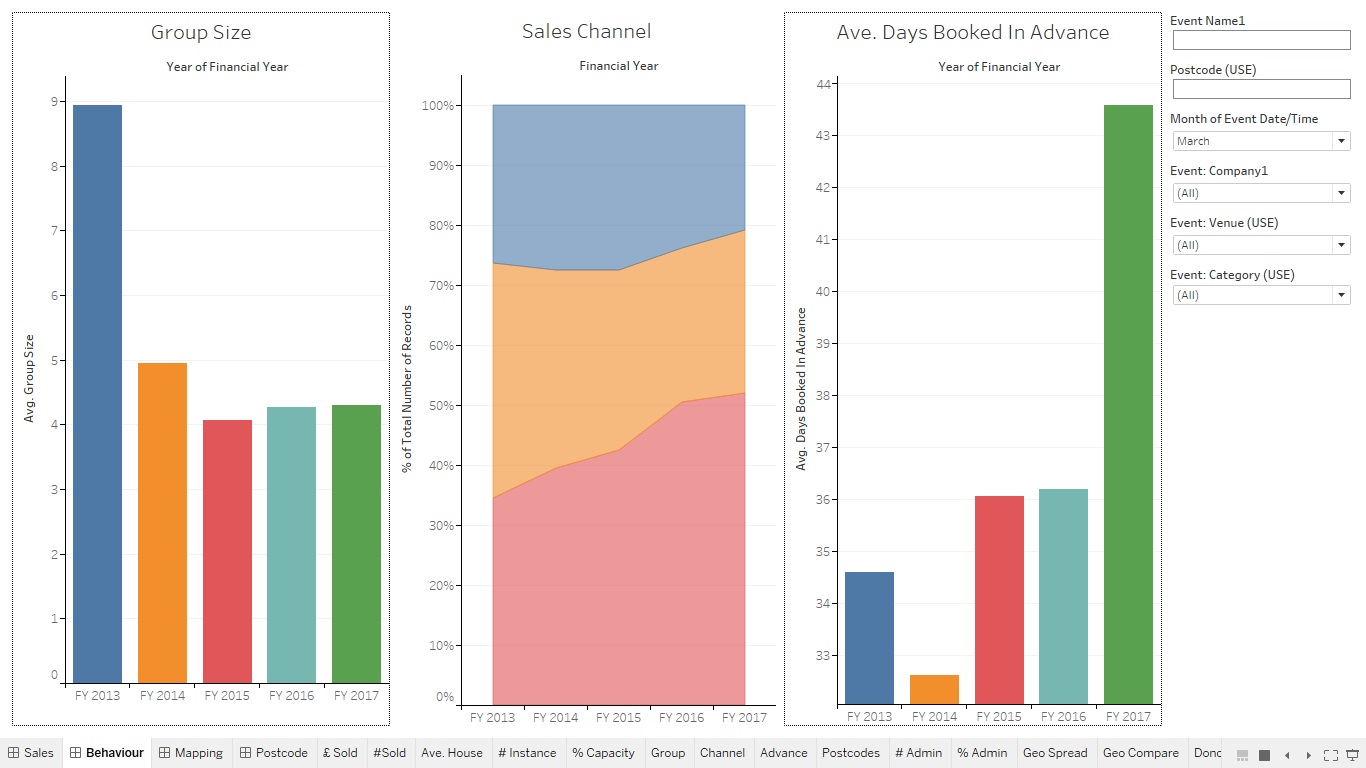
A really simple dashboard that looks at customer behaviour (this is the really basic one… I’m hiding the juicy dashboard for this).
Q – If you wanted to know the difference in audience % booking online between 3 different programmes of work across 5 financial years how fast can you find that out? 1 minute 30 sec?
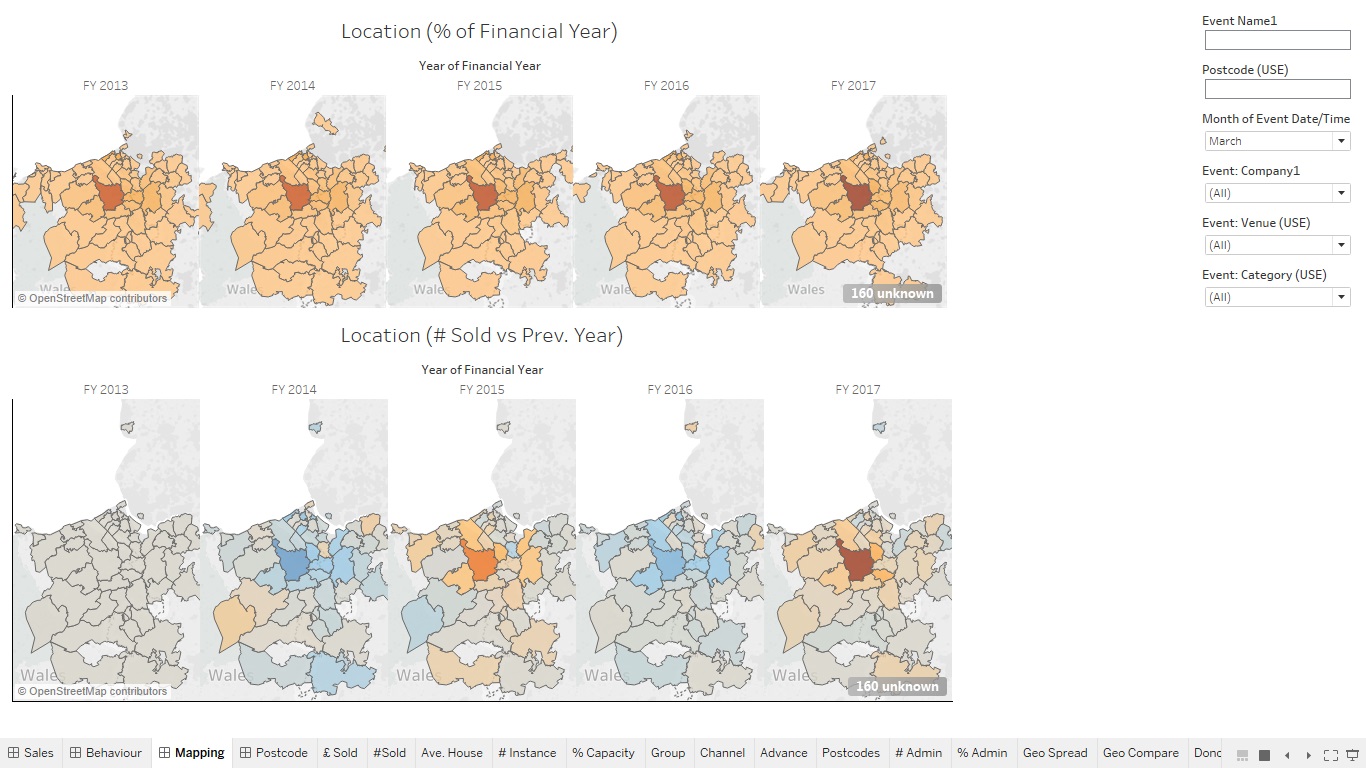
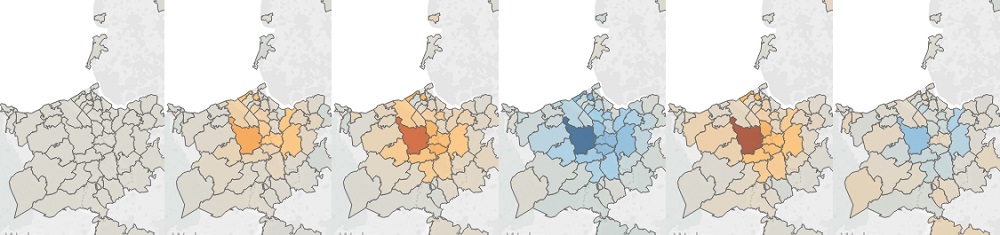
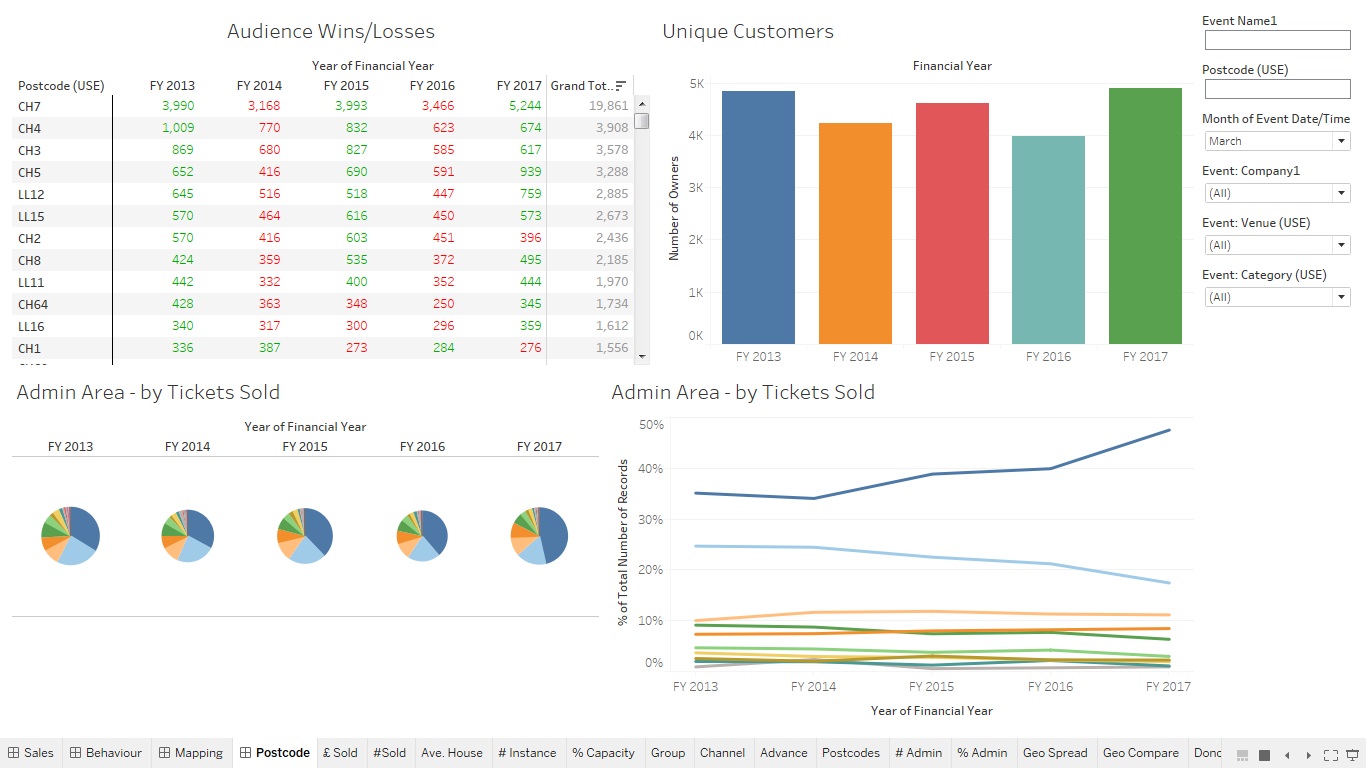
A really basic mapping exercise using the postcode area and districts that then looks at where you’re getting weaker and stronger, oh and can be filtered by venue, show, genre, date, time etc…
Q – In the postcode your venue is in is it getting more or less people this year, so far, than last year? 20 seconds to find out.
And this is a bit of an odd mix of data… In this (fake) example we see that 2017 in March had loads more visitors from a few postcodes… Know why? Not a clue, but knowing it means I can start to find out..
Obviously I’m overplaying the speed thing, it takes a while to learn and get set up – but in comparison to excel and manual reports this is like using a tractor and plough in you back garden instead of a trowel and spoon.
So, in conclusion, ditch excel, try a specialist data visualisation software, explore and ask questions and buy me cake.
I hope this is food for thought. Please let me know how you get on.
Best, Sam