
We’ve all been in that meeting right?
You know the one where 12 people are gathered round the table, slowly losing the will to live, while someone mutters the words ‘audiences’ in the middle distance. Occasionally someone will stir, breathing in a little too firmly as if about to make a valuable point, only the slump back down their spirit broken. Then the magic phrase will come out – “of course we all remember how The Rose Tinted Glasses show did…”, followed by mutters of agreement about its success, the full houses, the standing ovations and the huge box office income. And something in you tingles, it could be the coffee, after all you’ve had six today and it’s only 11am, but, wait… No.. It’s a bullshit tingle… You don’t remember The Rose Tinted Glasses show being anything than a half-empty self-indulgent snooze-fest for which you issued nearly 7,000 complimentary tickets to some unfortunate, and now permanently scarred, young people, all in the name of audience development. But you stay quiet – it’d take too long to run the data… After all what’s the worst that could happen… It’s not as if we’ll choose to remount it based on memory alone… Right…?
We’ve all sat there. The problem is that running reports takes so frigging long. And they never give you the rounded picture – to get that you need to run six reports, concurrently, merge them, dedupe them, print them out, highlight the relevant columns, and even after all that someone will probably say something about new audiences which isn’t on the report you’ve run.
So I decided to fix that. It’s been my spare time project for the last few months – refining something I did years ago and making it, well, good… And I’ve decided to share it and explain it. It’s built in PowerBi and uses Spektrix data, all curated, cleaned and automated (to an extent) to give me instant access to show data. How instant? Well swapping from one show to another takes less than 2 seconds – including the mapping.
Take a look (I’ve anonymised the event) then let me break it down:
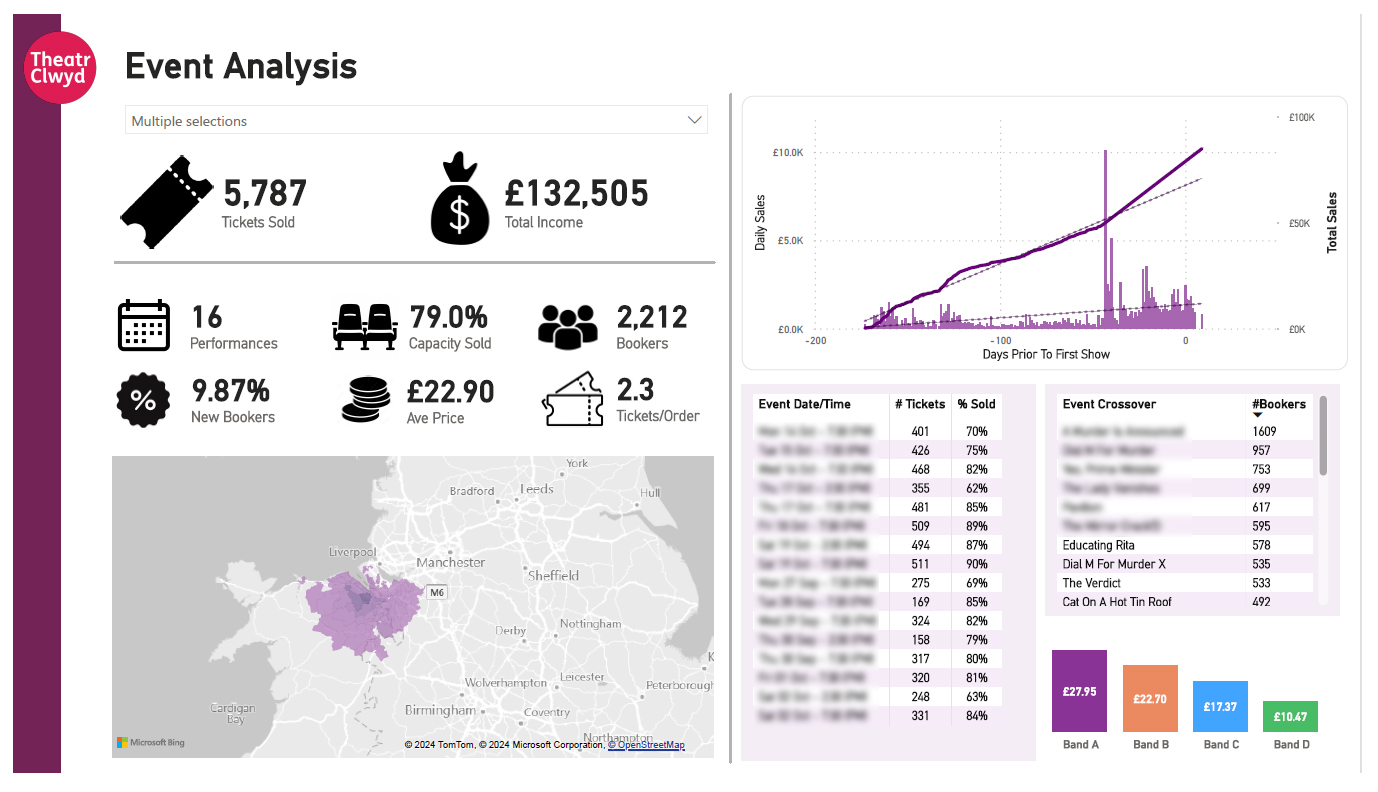
- “Multiple Selections” Menu
This is a searchable dropdown where you select the show (or shows) you want to get that headline data for. - Infographics
These are all calculated fields based on the transactional data – they’re the metrics I tend to find most handy in a headline way. Average price is great for benchmarking when forecasting, but truth be told, capacity sold and new bookers are vital. - Sales Trend Graph
Useful to know how a show is selling and sold – does it have a late sales curve or early – did the subscription work or not. I use this in tandem with another sheet that does the show by show comparison which is very handy (particularly for panto). - Event Date/Time
Often shows can get distorted by comps (which I chose to include in this), so looking at the spread of tickets can be really useful – did the show start strongly then die (which indicates word-of-mouth might be poor) or did it start weakly then sell out? Also a good memory jolter around matinees etc… - Event Crossover
This is surprisingly difficult to do in a really responsive way. I’ve used this already to look at what other past shows people booked for shows that we have coming up. Turns out people who like shows about crime & murder also like Educating Rita. - Price BandsI
Specifically this is for me around dynamic pricing. What you can’t see on this is that if I select one of the days and times in the Event Date/Time table then it readjusts and just shows data for that performance. Useful to get a picture of where yields were at different points in the run. - Map
Restricted to the top 50 postcodes otherwise it gets silly. It never changes hugely if I’m honest – little variances like Comedy Club and our cinema having a super local audience, Welsh language shows tilting towards West Wales more etc…
This isn’t designed to be an in-depth analytical tool remember – it’s designed to give an instant snapshot of an event, or an element of an event in less than 2 seconds. It’s really useful for programming, for top level post-show analysis and for the quick day-to-day questions like “did groups come to that show” or “should we programme The Rose Tinted show again”.
Finally.
If this is useful please drop me a message as it’s really encouraging and means I write more. So you know I’ve also got a dashboard that analyses facebook campaigns (and shows income), a google analytics and adwords dashboard (that is also income focused) AND loads more…
Finally finally.
As always if you want a chat or are a venue that needs a friendly ear for an hour then drop me a line. I’m free, mostly nice and can reliably spell Aberystwyth, which puts me in the top 1% of the UK population.
Best, Sam
2 responses to “Theatre Marketing – Getting Data Quickly”
Hi Sam,
This looks amazing and something that I’m currently working on for my organisation. Can I be cheeky and ask what reports you use from Spektrix to create your brilliant dashboard? I’ll be creating my report in Looker Studio as we use Google within our organisation.
If you have any time, it would be great to talk through this with you.
Sam this is SO good! Sensible and straightforward (although I imagine it took ages to build?). Having the right bits of data at your fingertips is so important. The meeting scenario is spot on, and reminiscent of many conversations we’ve had with people who say things like ‘new work used to sell before Covid but now it doesn’t’ – but when we look at the data it’s usually about the same. Thanks for sharing your brilliance.